Box D: The Expected Pick-up in the Home-building Sector
advertisement

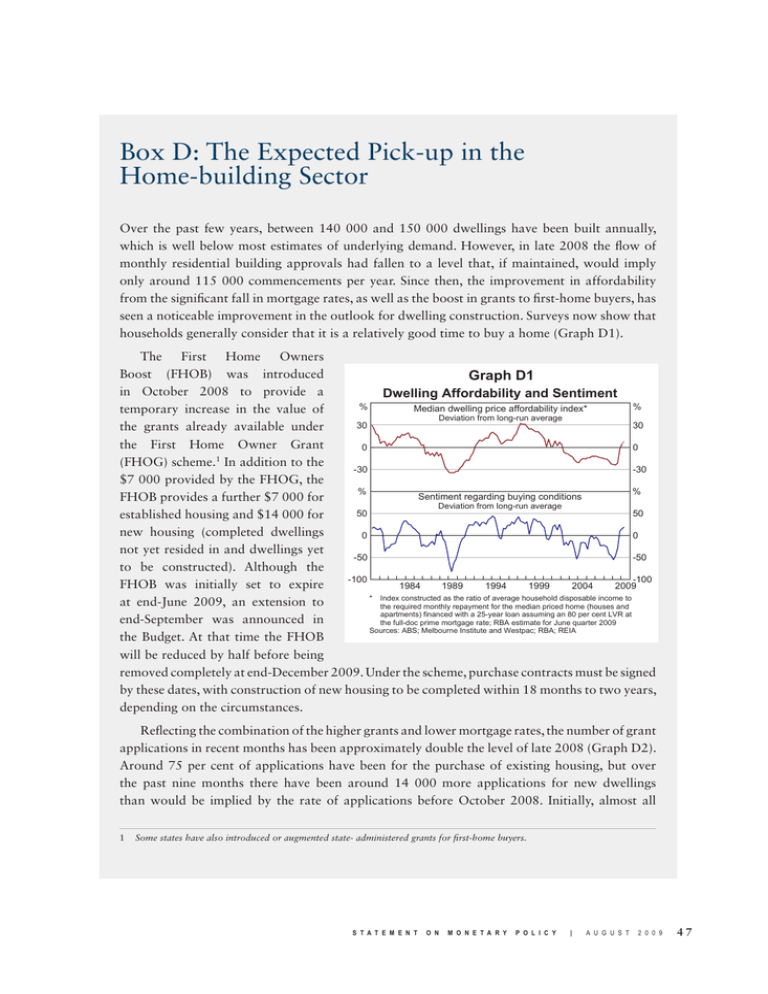
Box D: The Expected Pick-up in the Home-building Sector Over the past few years, between 140 000 and 150 000 dwellings have been built annually, which is well below most estimates of underlying demand. However, in late 2008 the flow of monthly residential building approvals had fallen to a level that, if maintained, would imply only around 115 000 commencements per year. Since then, the improvement in affordability from the significant fall in mortgage rates, as well as the boost in grants to first-home buyers, has seen a noticeable improvement in the outlook for dwelling construction. Surveys now show that households generally consider that it is a relatively good time to buy a home (Graph D1). The First Home Owners Boost (FHOB) was introduced Graph D1 in October 2008 to provide a Dwelling Affordability and Sentiment % % Median dwelling price affordability index* temporary increase in the value of Deviation from long-run average 30 30 the grants already available under the First Home Owner Grant 0 0 (FHOG) scheme. In addition to the -30 -30 $7 000 provided by the FHOG, the % % Sentiment regarding buying conditions FHOB provides a further $7 000 for Deviation from long-run average 50 50 established housing and $14 000 for new housing (completed dwellings 0 0 not yet resided in and dwellings yet -50 -50 to be constructed). Although the -100 -100 FHOB was initially set to expire 1984 1989 1994 1999 2004 2009 * Index constructed as the ratio of average household disposable income to at end-June 2009, an extension to the required monthly repayment for the median priced home (houses and apartments) financed with a 25-year loan assuming an 80 per cent LVR at end-September was announced in the full-doc prime mortgage rate; RBA estimate for June quarter 2009 Sources: ABS; Melbourne Institute and Westpac; RBA; REIA the Budget. At that time the FHOB will be reduced by half before being removed completely at end-December 2009. Under the scheme, purchase contracts must be signed by these dates, with construction of new housing to be completed within 18 months to two years, depending on the circumstances. Reflecting the combination of the higher grants and lower mortgage rates, the number of grant applications in recent months has been approximately double the level of late 2008 (Graph D2). Around 75 per cent of applications have been for the purchase of existing housing, but over the past nine months there have been around 14 000 more applications for new dwellings than would be implied by the rate of applications before October 2008. Initially, almost all � Some states have also introduced or augmented state- administered grants for first-home buyers. S t a t e m e n t o n M o n e t a r y P o l i c y | A U G U s T 2 0 0 9 47 Graph D2 First Home Owner Grant Payments* ’000 ’000 15 15 Established dwellings 12 12 9 9 6 6 New dwellings** 3 3 0 2001 2003 2005 2007 2009 0 * Not seasonally adjusted ** Includes newly constructed dwellings and dwellings yet to be constructed Source: NSW Office of State Revenue Graph D3 Owner-occupier Housing Loan Approvals Number ’000 ’000 Established dwellings* 40 40 30 30 20 20 First-home buyers New dwellings** 10 0 1999 2004 10 2009 2004 0 2009 of the increase in grant applications for new dwellings was for existing newly-built dwellings, but over the past few months there has been a significant pick-up in applications for dwellings yet to be constructed. While there is some evidence that the flow of grant applications has peaked for existing and newlybuilt housing, applications for new construction continued to increase in July. Lending finance data also show a strong pick-up in overall housing lending, particularly to first-home buyers. The share of loans going to first-time buyers has risen from just below 20 per cent in late 2008 to almost 30 per cent in May. The bulk of the increase in lending approvals has been for existing dwellings, although the number of approvals for loans for new owner-occupier dwellings has risen significantly since late 2008 (Graph D3). Over the seven months to May, there were around 13 000 additional loans for new dwellings, relative to the rate of lending seen prior to October. The prospective boost to housing construction has so far been less apparent in building approvals, which may partly reflect lags in the process. In contrast to the modest strengthening seen in building approvals for houses, approvals for apartments have continued to weaken (Graph D4). Bank liaison with builders indicates that high-rise developments remain constrained by the availability of finance. * Excludes refinancing ** Includes approvals for new construction and newly erected dwellings Sources: ABS; RBA Overall, it seems likely that there will be a significant increase in private housing commencements in 2009/10. There will also be some additional activity from the public sector, reflecting the Australian Government’s Social Housing Initiative to build around 20 000 new 48 R e s e r v e b a n k o f A u s t r a l i a dwellings by the end of 2010. However, the number of housing starts is likely to remain at levels well below most estimates of underlying demand. Lifting homebuilding in the longer-run will require further progress on the supply side, including addressing factors that are increasing the cost of development of new housing, both on the edges of cities and closer to the city centres.�� R Graph D4 Private Residential Building Approvals Number ’000 ’000 Houses 10 10 8 8 6 6 4 4 Apartments 2 0 2 2001 2003 Source: ABS S t a t e m e n t o n 2005 M o n e t a r y 2007 P o l i c y | 2009 A U G U s T 0 2 0 0 9 49


