Lecture 4: Two-sample t test Example Informal Analysis
advertisement
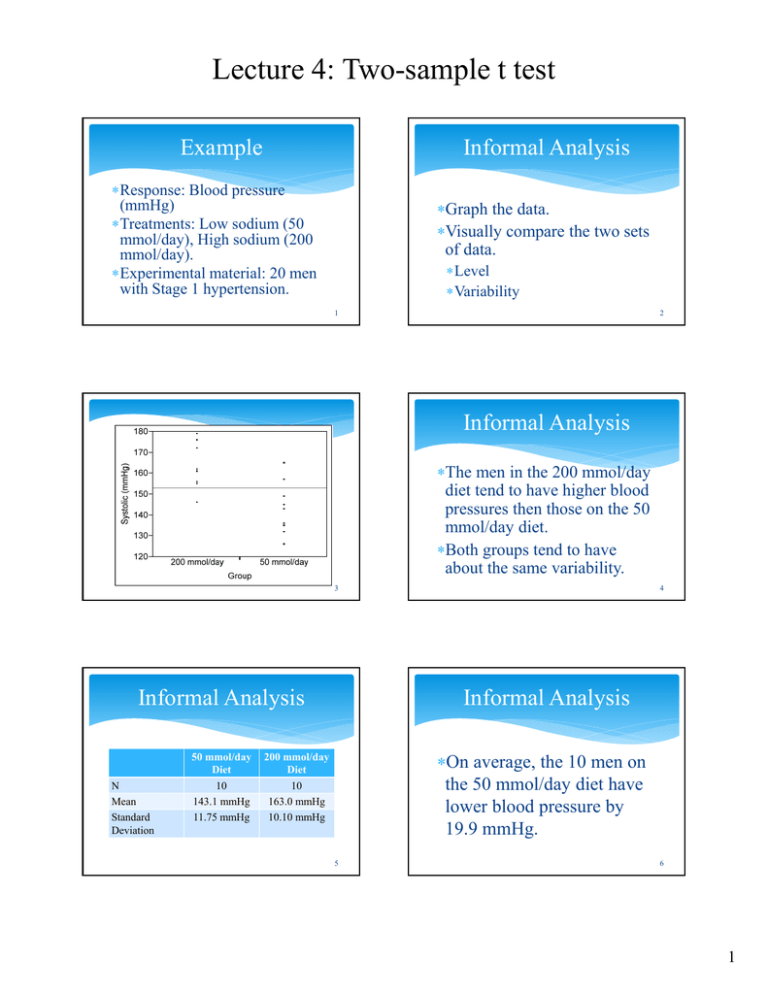
Lecture 4: Two-sample t test Example Informal Analysis Response: Blood pressure (mmHg) Treatments: Low sodium (50 mmol/day), High sodium (200 mmol/day). Experimental material: 20 men with Stage 1 hypertension. Graph the data. Visually compare the two sets of data. Level Variability 1 2 Informal Analysis The men in the 200 mmol/day diet tend to have higher blood pressures then those on the 50 mmol/day diet. Both groups tend to have about the same variability. 3 Informal Analysis N Mean Standard Deviation 50 mmol/day Diet 10 143.1 mmHg 11.75 mmHg 4 Informal Analysis On average, the 10 men on the 50 mmol/day diet have lower blood pressure by 19.9 mmHg. 200 mmol/day Diet 10 163.0 mmHg 10.10 mmHg 5 6 1 Lecture 4: Two-sample t test Informal Analysis Formal Analysis Blood pressures for men in both diets show about the same amount of variation. Model: ε i = 50 or 200 random error 7 8 Conditions Test of Hypothesis Random errors are identically and normally distributed with mean 0 and standard deviation, . : : or or 0 0 Directional alternative because there is prior information about lower sodium being good for blood pressure. 9 Estimation 10 Estimation = 143.1 is an estimate of = 11.75 is an estimate of . = 10.10 is an estimate of . = 163.0 is an estimate of = –19.9 is an estimate of 11 12 2 Lecture 4: Two-sample t test Pooled Estimate of 1 Pooled Estimate of 9 11.75 1 9 10.10 18 2 120.05 10.96 13 Test Statistic 1 1 19.9 4.90 Interpretation The difference in sample means (–19.9 mmHg) is 4.06 standard errors below zero. This is a large standardized difference. 19.9 0 10.96 14 1 10 1 10 4.06 15 16 P-value P-value The probability of observing a value of the test statistic as, or more, extreme than the one calculated, given the null hypothesis is true. P-value = 0.0004 17 18 3 Lecture 4: Two-sample t test Interpretation Conclusion The P-value is so small (smaller than 0.05) that we reject the null hypothesis in favor of the alternative. The difference in sample mean blood pressures for the two diets is statistically significant, it cannot be explained by random error alone. 19 Description 20 Conclusion Men on the low sodium diet had lower average blood pressure than those on the high sodium diet. The difference in sample mean blood pressures is statistically significant. 21 22 Inference Generalization The population mean for the 50 mmol/day diet is lower than than for the 200 mmol/day diet. Men with Stage 1 hypertension on a 50 mmol/day Na diet will have lower average blood pressure than men on a 200 mmol/day Na diet. 23 24 4
