Statistics 101: Section L - Laboratory 4
advertisement

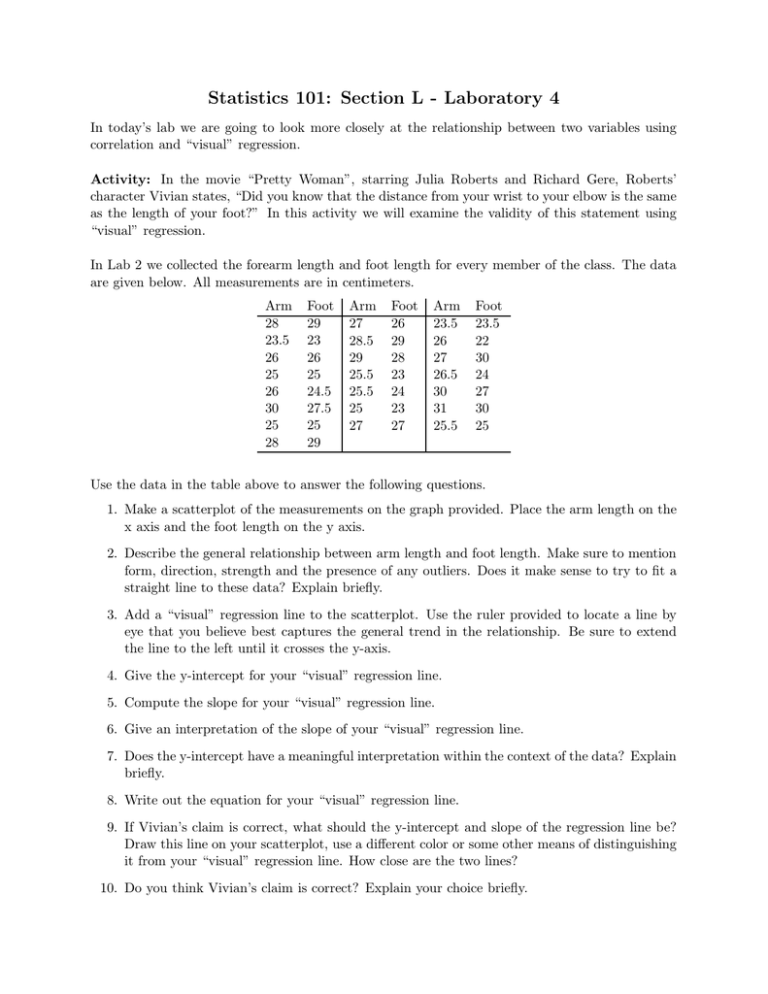
Statistics 101: Section L - Laboratory 4 In today’s lab we are going to look more closely at the relationship between two variables using correlation and “visual” regression. Activity: In the movie “Pretty Woman”, starring Julia Roberts and Richard Gere, Roberts’ character Vivian states, “Did you know that the distance from your wrist to your elbow is the same as the length of your foot?” In this activity we will examine the validity of this statement using “visual” regression. In Lab 2 we collected the forearm length and foot length for every member of the class. The data are given below. All measurements are in centimeters. Arm 28 23.5 26 25 26 30 25 28 Foot 29 23 26 25 24.5 27.5 25 29 Arm 27 28.5 29 25.5 25.5 25 27 Foot 26 29 28 23 24 23 27 Arm 23.5 26 27 26.5 30 31 25.5 Foot 23.5 22 30 24 27 30 25 Use the data in the table above to answer the following questions. 1. Make a scatterplot of the measurements on the graph provided. Place the arm length on the x axis and the foot length on the y axis. 2. Describe the general relationship between arm length and foot length. Make sure to mention form, direction, strength and the presence of any outliers. Does it make sense to try to fit a straight line to these data? Explain briefly. 3. Add a “visual” regression line to the scatterplot. Use the ruler provided to locate a line by eye that you believe best captures the general trend in the relationship. Be sure to extend the line to the left until it crosses the y-axis. 4. Give the y-intercept for your “visual” regression line. 5. Compute the slope for your “visual” regression line. 6. Give an interpretation of the slope of your “visual” regression line. 7. Does the y-intercept have a meaningful interpretation within the context of the data? Explain briefly. 8. Write out the equation for your “visual” regression line. 9. If Vivian’s claim is correct, what should the y-intercept and slope of the regression line be? Draw this line on your scatterplot, use a different color or some other means of distinguishing it from your “visual” regression line. How close are the two lines? 10. Do you think Vivian’s claim is correct? Explain your choice briefly. Statistics 101: Section L Laboratory 4 - Group Answer Sheet Group Members: Activity: 1. Scatterplot 2. Description of the scatterplot. 3. Add a “visual” regression line. 4. Give the y-intercept. 5. Compute the slope. 6. Interpretation of the slope. 7. Discussion of y-intercept. 8. Visual regression equation. Put this in terms of forearm length and foot length rather than x and y. 9. Vivian’s slope and y-intercept. Don’t forget to add this line to your graph. 10. Is Vivian correct?


