Stat 101: Lecture 7 Box Plots
advertisement
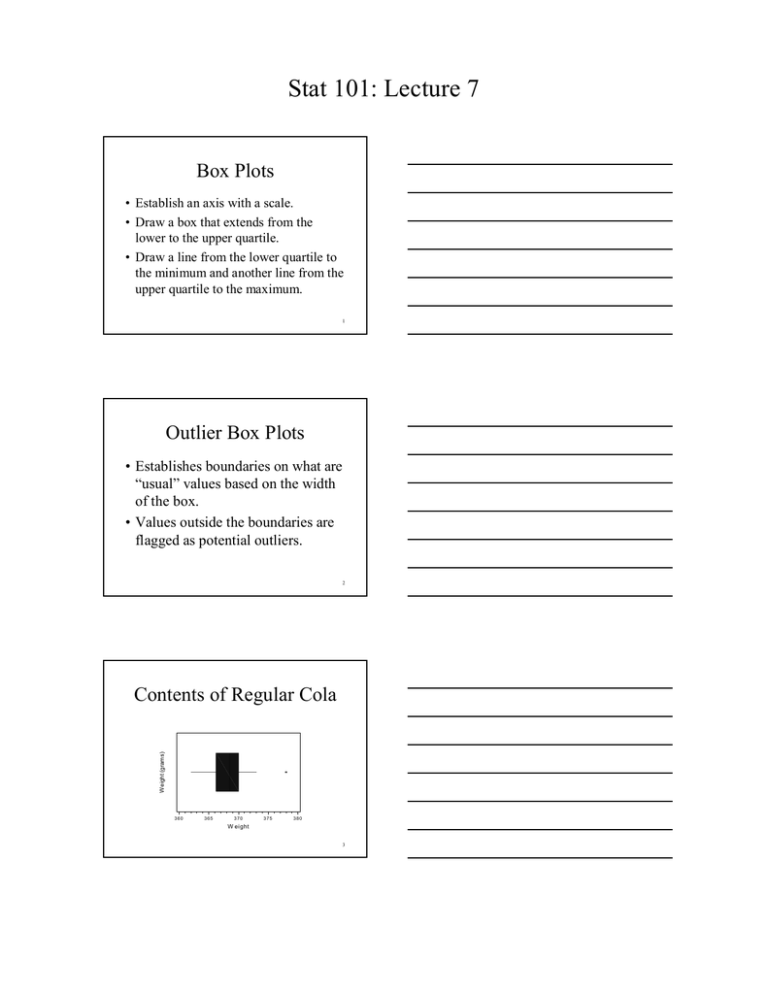
Stat 101: Lecture 7 Box Plots • Establish an axis with a scale. • Draw a box that extends from the lower to the upper quartile. • Draw a line from the lower quartile to the minimum and another line from the upper quartile to the maximum. 1 Outlier Box Plots • Establishes boundaries on what are “usual” values based on the width of the box. • Values outside the boundaries are flagged as potential outliers. 2 Weight (grams) Contents of Regular Cola 360 365 370 375 380 W eight 3 Stat 101: Lecture 7 Comparing Groups • Regular – Min: – QL: – Med: – QU: – Max: • Diet 362 g 366.5 g 368.5 g 370 g 378 g – Min: – QL: – Med: – QU: – Max: 349 g 352.5 g 354 g 355 g 357 g 4 Comparing Groups Cola Type R D 345 350 355 360 365 370 375 380 385 W eight (g ra m s ) 5 Comparing Groups • • • • Compare shape. Compare center. Compare spread. Compare outliers, if there are any. 6 Stat 101: Lecture 7 Comparing Groups 380 375 Weight 370 365 360 355 350 345 D R Cola Type 7 Symmetric Distributions • Measure of Center – Sample mean y= Total = n (∑ y ) i n 8 Octane Rating 87.4, 88.4, 88.7, 88.9, 89.3, 89.3, 89.6, 89.7 89.8, 89.8, 89.9, 90.0, 90.1, 90.3, 90.4, 90.4 90.4, 90.5, 90.6, 90.7, 91.0, 91.1, 91.1, 91.2 91.2, 91.6, 91.6, 91.8, 91.8, 92.2, 92.2, 92.2 92.3, 92.6, 92.7, 92.7, 93.0, 93.3, 93.7, 94.4 9 Stat 101: Lecture 7 Octane Rating 6 4 Count 8 2 85 90 95 Octane Rating 10 Octane Rating Mean • Total = 3637.9 • n = 40 y = Total 3637 . 9 = = 90 . 95 n 40 11 Mean or Median? • The sample mean is the balance point of the distribution. • The sample median divides the distribution into a lower and an upper half. • For skewed data, report the sample median. 12
