IE 361 Exam Keys/ Fall 2000 Exam 1 1. Use "
advertisement
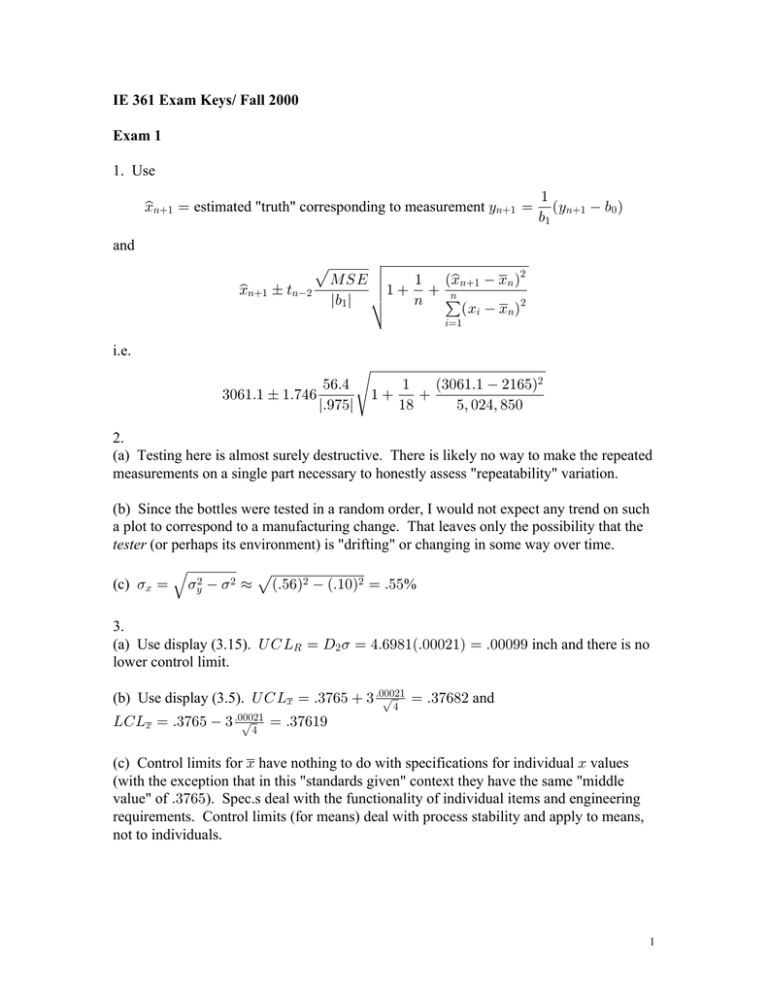
IE 361 Exam Keys/ Fall 2000
Exam 1
1. Use
B
s8€" œ estimated "truth" corresponding to measurement C8€" œ
and
"
aC8€" • ,! b
,"
Í
#
ÈQWI Í
s8€" • B8 b
Í " € " € aB
B
s8€" „ >8•#
8
k," k Í
8 !
aB3 • B8 b#
Ì
3œ"
i.e.
$!'"Þ" „ "Þ(%'
&'Þ%
"
Ð$!'"Þ" • #"'&Ñ#
"
€
€
lÞ*(&l Ë
")
&ß !#%ß )&!
2.
(a) Testing here is almost surely destructive. There is likely no way to make the repeated
measurements on a single part necessary to honestly assess "repeatability" variation.
(b) Since the bottles were tested in a random order, I would not expect any trend on such
a plot to correspond to a manufacturing change. That leaves only the possibility that the
tester (or perhaps its environment) is "drifting" or changing in some way over time.
(c) 5B œ É5C# • 5# ¸ ÈÐÞ&'Ñ# • ÐÞ"!Ñ# œ Þ&&%
3.
(a) Use display (3.15). Y G PV œ H# 5 œ %Þ'*)"ÐÞ!!!#"Ñ œ Þ!!!** inch and there is no
lower control limit.
(b) Use display (3.5). Y G PB œ Þ$('& € $ Þ!!!#"
È% œ Þ$(')# and
PGPB œ Þ$('& • $ Þ!!!#"
È% œ Þ$('"*
(c) Control limits for B have nothing to do with specifications for individual B values
(with the exception that in this "standards given" context they have the same "middle
value" of Þ$('&). Spec.s deal with the functionality of individual items and engineering
requirements. Control limits (for means) deal with process stability and apply to means,
not to individuals.
1
.
(d) We want "Þ#)# œ Þ$((!•
Þ!!!#" . This implies that . œ Þ$('($. Then we need two D values. D" œ Þ$(')#•Þ$('($
œ Þ)&(" and D# œ Þ$('"*•Þ$('($
œ • &Þ"%#*. Then ; œ T Òthe
Þ!!!#"ÎÈ%
Þ!!!#"ÎÈ%
first sample mean plots outside limitsÓ œ T Ò^ • • &Þ"%#* or
^ ž Þ)&("Ó ¸ " • Þ)!&" œ Þ"*%*. So EVP œ "Î; ¸ "ÎÞ"*%* œ &Þ"$.
4. This is a ? chart problem with a standard rate - œ Þ!""" jams/second. For the first
job 5 œ %*!, ?
s œ ""Î%*! œ Þ!##% with Y G P?s œ Þ!""" € $É Þ!"""
%*! œ Þ!#&% and no LCL
since Þ!""" € $É Þ!"""
%*! • !. This first job doesn't provide convincing evidence of a
change, but the second does. This is because for the second job 5 œ %(%,
?
s œ "&Î%(% œ Þ!$"' with Y G P?s œ Þ!""" € $É Þ!"""
%(% œ Þ!#&' (and no LCL since
Þ!""" € $É Þ!"""
%(% • !).
5. This computer control is NOT SPC/statistical process monitoring. It is a form
automated compensation/process tweaking/adjustment. (It's not really even EFC since it's
not even driven by a feedback mechanism.) SPC intends to watch/monitor a process
looking for change.
6. The purpose of Shewhart control charting is to detect process change/variation that can
potentially be eliminated.
7. Without good measurement one is "blind"! One can't know what is really going on.
Good measurement allows one to clearly see what is happening, allowing appropriate
interventions and verification that measured individuals are acceptable. It must be a high
priority to see that our company knows what its processes are doing and what its products
look like. I've got to have resources for this activity.
2
Exam 2
1.
(a) Var? œ Ð"Ñ# VarB# € Ð • "Ñ# VarB" œ ÐÞ!"Ñ# € ÐÞ!"Ñ# so
5? œ ÈVar? œ È#ÐÞ!"Ñ# œ Þ!"%"
(b)
`H
`?
œ
ˆ "# ‰#Ð&€?Ñ
`H
ÈÐ&€?Ñ# €@# and `@
#
#
#
#
Thus 5H
¸ Ð"Ñ ÐÞ!#Ñ € Ð!Ñ
ˆ "# ‰#@
ÈÐ&€?Ñ# €@# , so at
ÐÞ!#Ñ# and 5H ¸ Þ!#
œ
Ð?ß @Ñ œ Ð!ß !Ñ
`H
`?
œ " and
`H
`@
œ !.
(c) YES. The plot is very linear, indicating that the data set has a shape equivalent to that
#•Þ&
of the normal distribution. Then "•Þ&
#! œ Þ!#& and #! œ Þ!(&. So the first plotting
position is UD ÐÞ!#&Ñ œ • "Þ*' and UD ÐÞ!(&Ñ œ • "Þ%%.
(d) Use display (5.11), i.e. &Þ!!"( „ "Þ(#*ÐÞ!%$(ÑÉ" €
"
#! .
This is &Þ!!"( „ Þ!((%
Þ#
Þ#
É "!Þ""(
É $!Þ"%$
(e) Use display (5.7), i.e. Š 'ÐÞ!%$(Ñ
"* ß 'ÐÞ!%$(Ñ
"* ‹. This is ÐÞ&&(ß Þ*'"Ñ
s :5 œ minŠ &Þ"•&Þ!!"( ß &Þ!!"(•%Þ* ‹ œ Þ(%*) and the
(f) Use displays (5.9) and (5.10). G
$ÐÞ!%$(Ñ
$ÐÞ!%$(Ñ
"
lower confidence bound is thus Þ(%*) • "Þ#)#É *Ð#!Ñ
€ ÐÞ(%*)Ñ
#(#!)•# œ Þ&'(.
#
2.
(a) = ¸ QVÎ. # when there is no trend or pattern in the measurements and they therefore
"look like" a random sample from a fixed universe. (In this case these two quantities
estimate the same parameter "5" of a normal universe.) = ¦ QVÎ. # when there is an
obvious trend in the measurements that causes the "overall variability" in the observations
to exceed the kind of variability seen looking only at consecutive observations.
(b) Use displays (4.24) and (4.26). That is,
•"
Ð"Ñ#
Þ#Ð"ÑÐ"Ñ
#•!
#
\ œ %Ð# • !ß # • !ÑŒ
Þ#Ð"ÑÐ"Ñ
Ð"Ñ# • Œ # • ! •
"
• Þ#
#
#
" ‰
%
œ %Ð#ß #ш "•Þ!%
œ Þ*'
Ð"Þ'ß "Þ'ÑŒ • œ #'Þ'(
Œ • Þ#
•Œ
•
"
#
#
È
And Y G P\ # œ # € $ #Ð#Ñ œ ). Yes, there is an out-of-control signal.
3.
(a) Benchmarking should not only detail what "best in class performance" is, but also
how that performance is achieved. What are the engineering/business processes that
produce that best in class performance?
(b) As a performance goal, "six sigma" amounts to a G:5 œ # goal for all processes. as a
problem-solving/process improvement strategy, it refers to something very much like the
3
6-step QA cycle described in Chapter 1 of the textbook. As a training/recognition system,
it involves a "belt system" (like that of the martial arts) as one progresses in expertise and
company responsibility for implementing the problem-solving strategy.
(c) "CQE" certification is a program of the American Society for Quality. An applicant
for certification must have a degree from an accredited institution, 8 years of on-the-job
experience in the field (3 in a decision-making position) and "proof of professionalism"
(in the form of ASQ membership, PE registration or signatures from 2 "recognized
professional societies.") Applicants must also pass and exam set by ASQ.
(d) Correct. ISO 9000 certification is NOT about a particular batch of widgets you send
me. It is about consistency of how the certified organization does things. Having ISO
9000 certification supposedly guarantees that a company is doing things rationally and
methodically, that it has in place clear and universally understood and adhered to
processes for doing its work. I care about this because I need to know what to expect
from you on a consistent basis, and I believe that if you take this seriously I can expect
you to be continually better and more efficient, a continually better business partner.
4
Exam 3
1. c
2. a
3. d
4. a
5. d (the plus or minus value for a difference in means is È# times that for a single mean)
6. b
7. a
8. e (you must find +$ and ,$ and for each factor pick the level with the smallest, i.e. most
negative, main effect)
9. a
10. c
11. d
12. b
13. c
14. d
15. b
16. a
17. e (responses i) and iii) are true while ii) is not)
18. d
19. d
20. e
21. b (A Ç BCDG Ç ACDEFH Ç BEFGH)
22. c
5
