Mapping Science ~ History and Future
advertisement
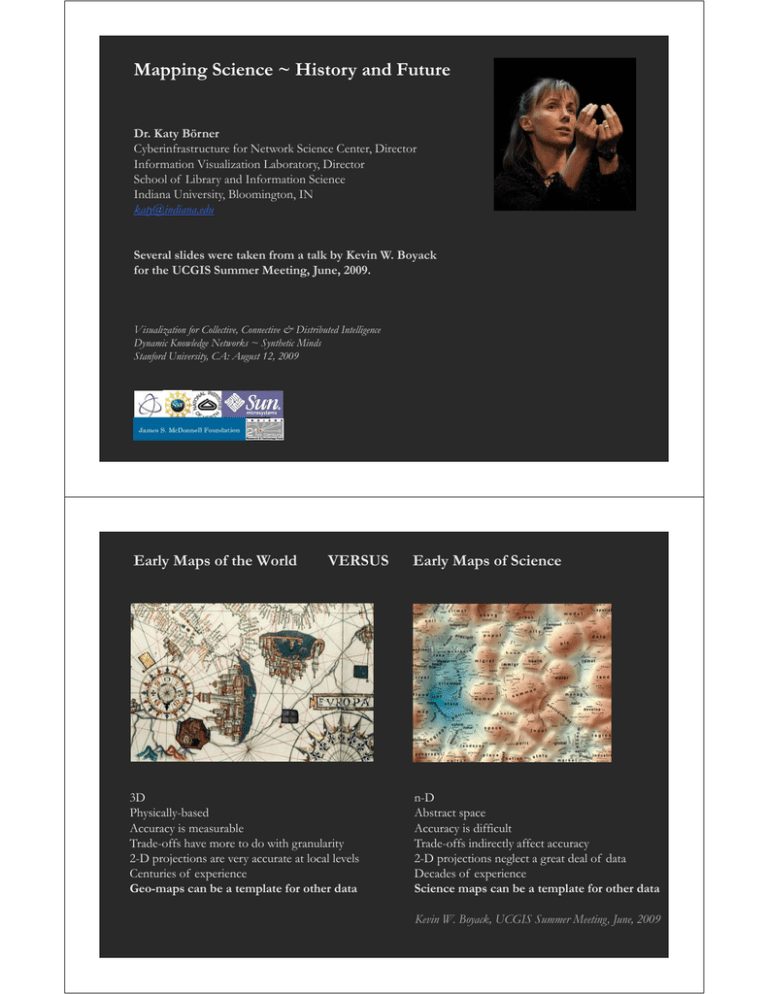
Mapping Science ~ History and Future Dr. Katy Börner Cyberinfrastructure for Network Science Center, Director Information Visualization Laboratory, Director School of Library and Information Science Indiana University, Bloomington, IN katy@indiana.edu Several slides were taken from a talk by Kevin W. Boyack for the UCGIS Summer Meeting, June, 2009. Visualization for Collective, Connective & Distributed Intelligence D Dynamic i Knowledge K l d Networks N k ~ Synthetic S h i Minds Mi d Stanford University, CA: August 12, 2009 Early Maps of the World VERSUS 3D Physically-based Accuracy is measurable Trade-offs have more to do with granularity 2-D projections are very accurate at local levels Centuries of experience Geo-maps can be a template for other data Early Maps of Science n-D Abstract space Accuracy is difficult Trade-offs indirectly affect accuracy 2-D projections neglect a great deal of data Decades of experience Science maps can be a template for other data Kevin W. Boyack, UCGIS Summer Meeting, June, 2009 Towards a World Map Portolan chart of the central and western Mediterranean and part of the Atlantic - Bartolome Olives - 1559 Islandia - Abraham Ortelius (1527-1598) - 1606 In 1696, 1696 the first accurate map (shown below left) of the Earth was drawn by César-François Cassini de Thury based on 40 points (given in red) of accurate latitude and longitude. The north-south position (latitude) of any point on Earth could be determined via star paths. To measure the east-west position (longitude), exact time measurement was essential: one minute of uncertainty implied a 10-mile margin of error in location. Inspired by Galileo’s work, the mapmakers used the planet Jupiter as a “clock in the sky.” They carefully recorded the motions of Jupiter’s moons (see Cassini’s 1668 table of the eclipses of Jupiter’s moons below). In 1744, Cassini Cassini’ss team started to map France in a rigorous fashion using triangulation. triangulation In the late 1700s 1700s, the world world’ss first national land survey of France was completed. In 1870, Captain George Everest embarked to map India by triangulation. For generations, a vast network of repeating sightline triangles was meticulously measured and recorded (see map below). What resembles a pattern of eyelashes on the northern border represents the sightlines to stations built above treetops. While analyzing the triangles in the calculating offices of Calcutta, the mapmakers discovered the highest peak in the world: Mount Everest A New Map of the Whole World with Trade Winds According to the Latest and Most Exact Observations - Herman Moll - 1736 Towards a Map of all Sciences 2002 ‘Base Map’ of Science Kevin W. Boyack, Katy Börner, & Richard Klavans (2007). Mapping the Structure and Evolution of Ch i Research. Chemistry R h 11th 11 h International I i l Conference C f on Scientometrics Si i andd Informetrics. I f i pp. 112-123. 112 123 Uses combined SCI/SSCI from 2002 • 1.07M papers, 24.5M references, 7,300 journals • Bibliographic coupling of p p r aggregated papers, r t d tto journals Initial ordination and clustering of journals gave 671 clusters Coupling counts were reaggregated at the journal cluster level to calculate the • (x,y) positions for each journal cluster • by association, (x,y) positions ii for f each h jjournall Math Law Policy Computer Tech Statistics Economics Education CompSci Vision Phys-Chem Chemistry Physics Psychology Brain Environment Psychiatry GeoScience MRI Biology BioMaterials BioChem Microbiology Pl t Plant Cancer Animal Disease & Treatments Virology Infectious Diseases Science map applications: Identifying core competency Kevin W. Boyack, Katy Börner, & Richard Klavans (2007). Funding patterns of the US Department of Energy (DOE) Math Law Computer Tech Policy Statistics Economics CompSci Vision Education Phys-Chem Chemistry Physics Psychology Brain Environment GeoScience Psychiatry MRI Biology GI BioBi Materials BioChem Microbiology Plant Cancer Animal Virology Infectious Diseases Science map applications: Identifying core competency Kevin W. Boyack, Katy Börner, & Richard Klavans (2007). Funding Patterns of the National Science Foundation (NSF) Math Law Computer Tech Policy Statistics Economics CompSci Vision Education Phys-Chem Chemistry Physics Psychology Brain Environment Psychiatry GeoScience MRI Biology GI BioBi Materials BioChem Microbiology Plant Cancer Animal Virology Infectious Diseases Science map applications: Identifying core competency Kevin W. Boyack, Katy Börner, & Richard Klavans (2007). Funding Patterns of the National Institutes of Health (NIH) Math Law Computer Tech Policy Statistics Economics CompSci Vision Education Phys-Chem Chemistry Physics Psychology Brain Environment Psychiatry GeoScience MRI Biology GI BioBi Materials BioChem Microbiology Plant Cancer Animal Virology Infectious Diseases Towards a Consensus Map of Science Kevin W. Boyack, UCGIS Summer Meeting, June, 2009 Milestones of Mapping Science 1934 2007 Börner, Katy. (2010). Atlas of Science: Visualizing What We Know. MIT Press. 1930 1955 Zoom into one map and legend 1952 1973 1980 1982 1987 1997 1997 1999 1999 2001 2000 2002 2003 2004 2005 2006 Cambrian explosion ~ seemingly rapid appearance of most major groups of complex animals around 530 million years ago. New work is built on existing work. Each of the examples below cites a series of works that developed in a progressive fashion, as one born from the other: Garfield Garfield’ss original historiography of DNA research (1962); his long-term long term development of HistCite (first published in 2004); and his exhibit map (2006), which incorporates a re-rendering of the 1962 historiography and the application of HistCite. White et al.’s pioneering Maps of Co-Cited Authors (1982), Map of Information Science (1998), and the interactive AuthorLink (2002). Tobler’s T bl ’ early l works k on the h visualization i li i off flow, fl his hi Flow Fl Mapper M tooll (1987), (198 ) andd the h tool’s l’ application in geospatial and network journal data (2005). Shneiderman’s introduction of treemap layouts (1992, their utilization in the Dewey Map (1992), H. Chen’s ET Map (1995), and later Wattenberg’s Map of the Market (1989) and Smith et al.’s Usenet visualizations z ((2005). ) White and McCain’s Map of Information Science (1998) and Old’s GIS rendering of same (2001). C. Chen’s Collaborative Information Spaces (1999), Multi-Layer Science Maps (2001), Mapping Scientific Frontiers (2004), and Mapping the Universe (2007); and his continuous development of CiteSpace for trend analysis (2004). Batty B et al.’s l ’ workk on the h geography h off science i (2003 andd 2006). 2006) Moody et al.’s studies of contour sociograms (2004) and longitudinal social network movies (2005). Boyack and Klavan’s work toward a base map of science followed by the creation of a series of maps (2005 (2005–2007) 2007). Over time, former tools are subsumed by new tools, software APIs, and libraries. Examples include the Information Visualization Cyberinfrastructure (2003), Fekete’s The InfoVis Toolkit (2004), and the Network Workbench (2006). Mashups also emerge, emerge such as Herr et al. al.’ss Interactive Google Map of 2006 Society for Neuroscience Abstracts. Science as accumulation of knowledge. knowledge Areas of science are tube shaped. shaped Authors are mortal. Papers are immortal. “Scholarly brick laying”. Monsters = ‘the or of voids. onunknown’ the shoulders of giants. This drawing attempts toStanding shows the “structure” science. Crust of science “funding” or “usage”. Impactcan of represent funding on science (yellow). and badknit years. Densely communities Many are interestedGood to understand thecommunities. “dynamics” dynamics of science. science The importance of weak links. Hypothetical Model of the Evolution of Science - Daniel Zeller - 2007 http://sci.slis.indiana.edu 41 Thi is This i the th only l mockup k in i this thi slide lid show. h E Everything hi else l iis available il bl today. d Katy Borner: Computational Scientometrics That Informs Science Policy 43 Papers, maps, cyberinfrastructures, talks, press are linked from http://cns.slis.indiana.edu 44
