Teaching Children the Structure of Science Structure of Science
advertisement
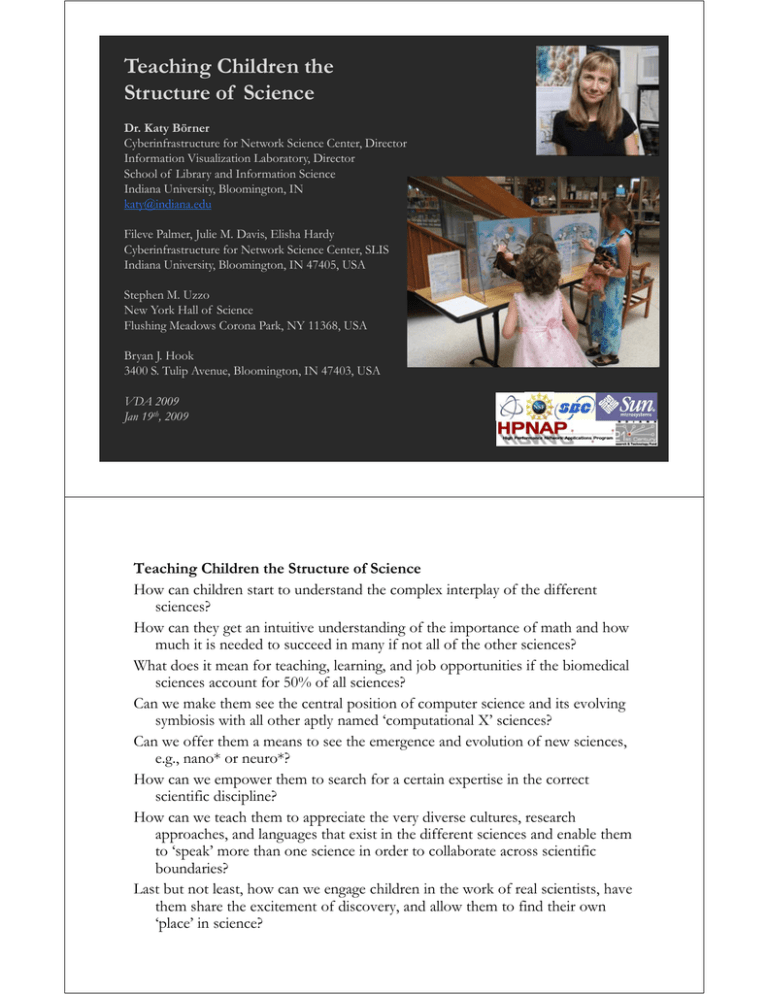
Teaching Children the Structure of Science Dr. Katy Börner Cyberinfrastructure for Network Science Center, Director I f Information ti Visualization Vi li ti Laboratory, L b t Director Di t School of Library and Information Science Indiana University, Bloomington, IN katy@indiana.edu Fileve Palmer, Julie M. Davis, Elisha Hardy Cyberinfrastructure for Network Science Center, SLIS Indiana University, Bloomington, IN 47405, USA Stephen M. Uzzo New York Hall of Science Flushing Meadows Corona Park, NY 11368, USA Bryan J. Hook 3400 S. Tulip Avenue, Bloomington, IN 47403, USA VDA 2009 Jan 19th, 2009 Teaching Children the Structure of Science How can children start to understand the complex interplay of the different sciences? How can they get an intuitive understanding of the importance of math and how much it is needed to succeed in manyy if not all of the other sciences? What does it mean for teaching, learning, and job opportunities if the biomedical sciences account for 50% of all sciences? Can we make them see the central position of computer science and its evolving symbiosis with all other aptly named ‘computational X’ sciences? Can we offer them a means to see the emergence and evolution of new sciences, e.g., nano* or neuro*? H can we empower them How h to search h ffor a certain i expertise i iin the h correct scientific discipline? How can we teach them to appreciate the very diverse cultures, research approaches and languages that exist in the different sciences and enable them approaches, to ‘speak’ more than one science in order to collaborate across scientific boundaries? g g children in the work of real scientists, have Last but not least, how can we engage them share the excitement of discovery, and allow them to find their own ‘place’ in science? Computational Scientometrics: S d i S Studying Science i b by S Scientific i ifi M Means B Börner, Katy, K Chen, Ch Chaomei, Ch i andd Boyack, B k Kevin. K i (2003). (2003) Visualizing Vi li i K Knowledge l d D Domains. i In I Blaise Cronin (Ed.), Annual Review of Information Science & Technology, Medford, NJ: Information Today, Inc./American Society for Information Science and Technology, Volume 37, Chapter 5, pp. 179255. http://ivl.slis.indiana.edu/km/pub/2003-borner-arist.pdf p // / /p / p Shiffrin, Richard M. and Börner, Katy (Eds.) (2004). Mapping Knowledge Domains. Proceedings of the National Academy of Sciences of the United States of America, 101(Suppl_1). http://www.pnas.org/content/vol101/suppl_1/ Börner, Bö Katy, K t Sanyal, S l Soma S andd Vespignani, V pi i Al Alessandro d (2007). (2007) Network N t k Science. S i I Blaise In Bl i Cronin (Ed.), Annual Review of Information Science & Technology, Information Today, Inc./American Society for Information Science and Technology, Medford, NJ, Volume 41, Chapter 12, pp. 537-607. http://ivl.slis.indiana.edu/km/pub/2007-borner-arist.pdf p p p Places & Spaces: Mapping Science exhibit, see also http://scimaps.org. 3 Process of Analyzing and Mapping Knowledge Domains , Topics Börner, Katy, Chen, Chaomei, and Boyack, Kevin. (2003) Visualizing Knowledge Domains. In Blaise Cronin (Ed.), Annual Review of Information Science & Technology, Volume 37, Medford, NJ: Information Today, Inc./American Society for Information Science and Technology Technology, chapter 55, pp pp. 179 179-255. 255 Latest ‘Base Map’ of Science Kevin W. Boyack, Katy Börner, & Richard Klavans (2007). Mapping the Structure and Evolution of Ch i Research. Chemistry R h 11th 11 h International I i l Conference C f on Scientometrics Si i andd Informetrics. I f i pp. 112-123. 112 123 Uses combined SCI/SSCI from 2002 • 1.07M papers, 24.5M references, 7,300 journals • Bibliographic coupling of p p r aggregated papers, r t d tto journals Initial ordination and clustering of journals gave 671 clusters Coupling counts were reaggregated at the journal cluster level to calculate the • (x,y) positions for each journal cluster • by association, (x,y) positions ii for f each h jjournall Math Law Computer Tech Policy Statistics Economics CompSci Vision Education Phys-Chem Chemistry Physics Psychology Brain Environment Psychiatry MRI Biology BioMaterials BioChem Microbiology Pl t Plant Cancer Animal Disease & Treatments Virology Infectious Diseases Science map applications: Identifying core competency Kevin W. Boyack, Katy Börner, & Richard Klavans (2007). Funding patterns of the US Department of Energy (DOE) Math Law Computer Tech Policy Statistics Economics CompSci Vision Education Phys-Chem Chemistry Physics Psychology Brain Environment Psychiatry GeoScience MRI Biology GI GeoScience BioBi Materials BioChem Microbiology Plant Cancer Animal Virology Infectious Diseases Science map applications: Identifying core competency Kevin W. Boyack, Katy Börner, & Richard Klavans (2007). Funding Patterns of the National Science Foundation (NSF) Math Law Computer Tech Policy Statistics Economics CompSci Vision Education Phys-Chem Chemistry Physics Psychology Brain Environment GeoScience Psychiatry MRI Biology GI BioBi Materials BioChem Microbiology Plant Cancer Animal Virology Infectious Diseases Science map applications: Identifying core competency Kevin W. Boyack, Katy Börner, & Richard Klavans (2007). Funding Patterns of the National Institutes of Health (NIH) Math Law Computer Tech Policy Statistics Economics CompSci Vision Education Phys-Chem Chemistry Physics Psychology Brain Environment Psychiatry GeoScience MRI Biology GI BioBi Materials BioChem Microbiology Plant Cancer Animal Virology Infectious Diseases Places & Spaces: Mapping Science a science exhibit that introduces people to maps of sciences, their h i makers k and d users. http://scimaps.org. Exhibit Curators: Dr. Katy Börner & Elisha F. Hardy 9 Mapping Science Exhibit – 10 Iterations in 10 years The Power of Maps (2005) Science Maps for Economic Decision Makers (2008) The Power of Reference Systems y (2006) ( ) Science Maps p for Science Policyy Makers (2009) ( ) Science Maps for Scholars (2010) Science Maps as Visual Interfaces to Digital Libraries (2011) Science Maps for Kids (2012) Science Forecasts (2013) How to Lie with Science Maps (2014) The Power of Forecasts (2007) scimaps.org Illuminated Diagram Display W. Bradford Paley, Kevin W. Boyack, Richard Kalvans, and Katy Börner (2007) Mapping, Illuminating and Illuminating, Interacting with Science. SIGGRAPH 2007, San Diego, CA. Science Puzzle Map for Kids by Fileve Palmer, Julie Smith, Elisha Hardy and Katy Börner, Indiana University, 2006. (Base map taken from Illuminated Diagram display by Kevin Boyack, Richard Klavans, and W. Bradford Paley.) Activities: Solve the puzzle. Navigate to ‘Earth Science’. Identify major inventions. Place major inventors. Find your dream job on the map. Why is mathematics important? Winners @ AMSE JoHanna Sanders, age 12, a picture of someone enjoying nature and a theme that science is all around us. Sascha Richey, age 8, drew a picture of her mother and explained why her mother is her favorite scientist. http://cns.slis.indiana.edu
