STATISTICS 402B Spring 2016 Homework Set#3 Solution 1.
advertisement
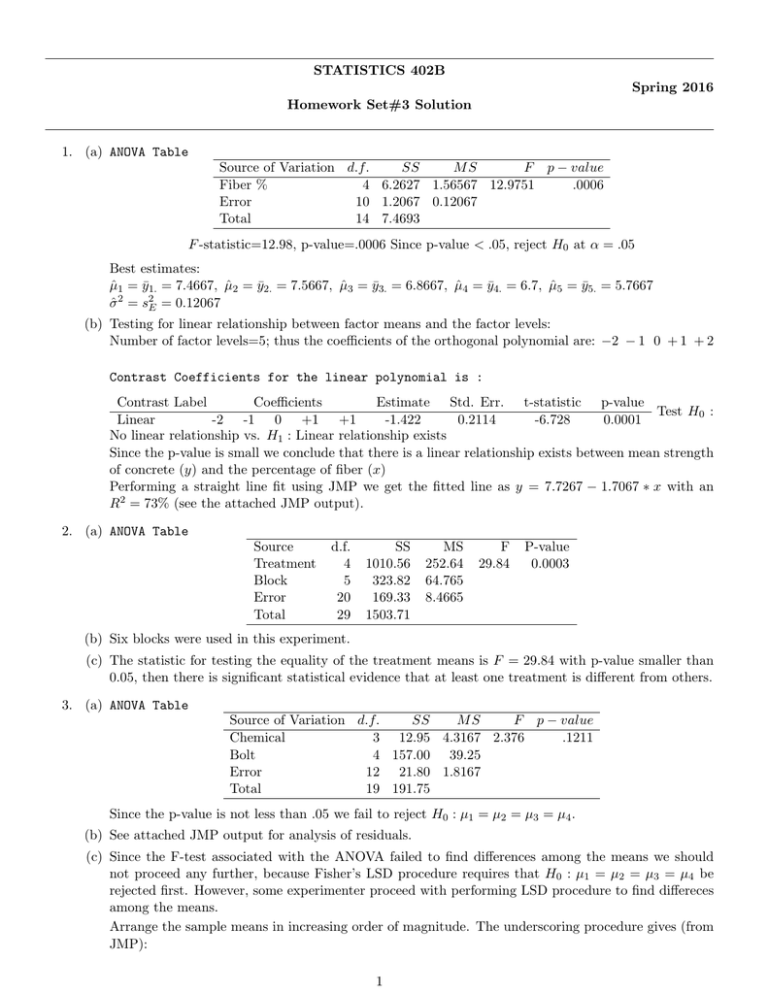
STATISTICS 402B Spring 2016 Homework Set#3 Solution 1. (a) ANOVA Table Source of Variation d.f. SS MS F p − value Fiber % 4 6.2627 1.56567 12.9751 .0006 Error 10 1.2067 0.12067 Total 14 7.4693 F -statistic=12.98, p-value=.0006 Since p-value < .05, reject H0 at α = .05 Best estimates: µ̂1 = ȳ1. = 7.4667, µ̂2 = ȳ2. = 7.5667, µ̂3 = ȳ3. = 6.8667, µ̂4 = ȳ4. = 6.7, µ̂5 = ȳ5. = 5.7667 σ̂ 2 = s2E = 0.12067 (b) Testing for linear relationship between factor means and the factor levels: Number of factor levels=5; thus the coefficients of the orthogonal polynomial are: −2 − 1 0 + 1 + 2 Contrast Coefficients for the linear polynomial is : Contrast Label Coefficients Estimate Std. Err. t-statistic p-value Test H0 : Linear -2 -1 0 +1 +1 -1.422 0.2114 -6.728 0.0001 No linear relationship vs. H1 : Linear relationship exists Since the p-value is small we conclude that there is a linear relationship exists between mean strength of concrete (y) and the percentage of fiber (x) Performing a straight line fit using JMP we get the fitted line as y = 7.7267 − 1.7067 ∗ x with an R2 = 73% (see the attached JMP output). 2. (a) ANOVA Table Source Treatment Block Error Total d.f. 4 5 20 29 SS 1010.56 323.82 169.33 1503.71 MS 252.64 64.765 8.4665 F 29.84 P-value 0.0003 (b) Six blocks were used in this experiment. (c) The statistic for testing the equality of the treatment means is F = 29.84 with p-value smaller than 0.05, then there is significant statistical evidence that at least one treatment is different from others. 3. (a) ANOVA Table Source of Variation d.f. SS MS F p − value Chemical 3 12.95 4.3167 2.376 .1211 Bolt 4 157.00 39.25 Error 12 21.80 1.8167 Total 19 191.75 Since the p-value is not less than .05 we fail to reject H0 : µ1 = µ2 = µ3 = µ4 . (b) See attached JMP output for analysis of residuals. (c) Since the F-test associated with the ANOVA failed to find differences among the means we should not proceed any further, because Fisher’s LSD procedure requires that H0 : µ1 = µ2 = µ3 = µ4 be rejected first. However, some experimenter proceed with performing LSD procedure to find differeces among the means. Arrange the sample means in increasing order of magnitude. The underscoring procedure gives (from JMP): 1 Chemical Means 1 2 3 4 70.6 71.4 72.4 72.6 —————————————————- 4. (a) ANOVA Table Source of Variation d.f. SS MS F p − value Tip 3 0.385 0.1283 14.4375 .0009 Coupon 3 0.825 0.275 Error 9 0.08 0.008889 Total 15 1.29 Since the p-value is less than .05 we reject H0 : µ1 = µ2 = µ3 = µ4 . (b) See attached JMP output for analysis of residuals. (c) Since the F-test associated with the ANOVA failed to find differences among the means we should not proceed any further, because Fisher’s LSD procedure requires that H0 : µ1 = µ2 = µ3 = µ4 be rejected first. However, some experimenter proceed with performing LSD procedure to find differeces among the means. Arrange the sample means in increasing order of magnitude. The underscoring procedure gives (from JMP): Chemical Means 3 1 2 9.45 9.575 9.6 ————————- 4 9.875 ————— 5. (a) First randomly allocate the three Oils (A, B, C) to 3 piston rings of each type (using random permutations of the three letters): Piston Ring 1 2 3 4 Brand of Oil C A B C B A B A C A C B Then obtain a random permuation of integers 1 through 12 to determine the order of the runs: Piston Ring 1 2 3 4 Run Order 6 12 1 10 7 9 11 3 4 5 8 2 So Run 1 will be to test the third piston ring of Type 1 with Oil B Run 2 will be to test the third piston ring of Type 4 with Oil B Run 3 will be to test the second piston ring of Type 3 with Oil A etc,; (b) ANOVA Table Source of Variation d.f. SS MS F p − value Brand 2 0.0374 0.01869 11.1225 0.0096 Piston Ring Type 3 1.296 0.432 Error 6 0.010 0.001681 Total 11 1.3434 Since the p-value is less than .05 we reject H0 : µ1 = µ2 = µ3 . 2 (c) See attached JMP output for analysis of residuals. (d) µ2 + µ 3 µ2 + µ 3 = 0 vsHa : µ1 − >0 2 2 i.e. the contrast is c=(1,-0.5,-0.5) The t-statistics is H0 : µ1 − t0 = sE P3 i=1 ci µ̂i qP 3 2 i=1 ci /4 = 4.7151 The p-value is 0.00165 which is smaller than 0.05. So there is statistical signifcant evidence to reject null hypothesis. JMP for Problem1 3 4 5 6 7
