Estimating Seeding Dates for Winter Canola in Iowa Rafael Martinez-Feria
advertisement
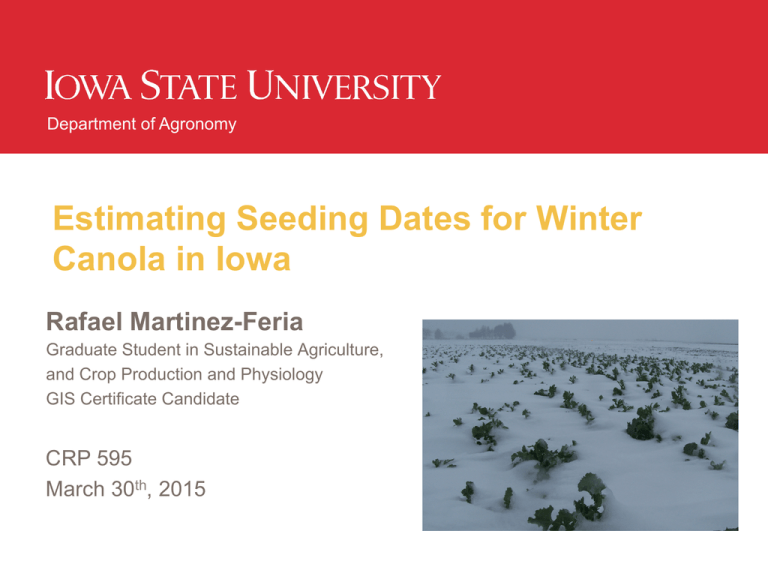
Department of Agronomy Estimating Seeding Dates for Winter Canola in Iowa Rafael Martinez-Feria Graduate Student in Sustainable Agriculture, and Crop Production and Physiology GIS Certificate Candidate CRP 595 March 30th, 2015 The efforts here presented are possible thanks to the involvement of multiple parties. Funding: North Central SARE Leopold Center for Sustainable Agriculture Vernon C. Miller Scholarship in Agronomy Advise: Dr. Mary Wiedenhoeft Dr. Tom Kaspar Midwest Cover Crop Council 2 Department of Agronomy Presentation Outline • • • • • Background Methods • Conventional Method • Proposed Method • Spatial Interpolation Results Conclusion Seeding date atlas for winter canola in Iowa 3 Department of Agronomy Unsustainable erosion and nutrient pollution of water bodies is a major drawback of conventional crop rotations. (NRCS, 2013) 4 Department of Agronomy Growing winter crops grown after harvest of summer helps conserve soil and water. (Lime Creek Watershed Improvement Association, 2012) 5 Department of Agronomy Living covers prevent soil erosion and nutrient pollution. (NRCS, 2013) 6 Department of Agronomy Winter canola could be used to provide soil cover during the winter in Iowa. Sorenson Farm plots, Nov 2012 7 Department of Agronomy Winter canola can potentially produce a marketable oilseed crop. Sorenson Farm plots, Jul 2013 8 Department of Agronomy Midwest farmers report planting winter crops in the fall is challenging. (North Central SARE Survey, 2013) 9 Department of Agronomy Planting winter crops winter crops in the fall is a race against time. Average Fall Air Temperature, Ames IA 90 80 Temperature (F) 70 60 50 Mean 40 Max 30 Min 20 10 0 230 250 270 290 310 330 350 Day of year 10 Department of Agronomy There are tools available to help farmers time their cover crop plantings. 11 Department of Agronomy Research Question How late can we plant winter canola to achieve sufficient growth and winter survival in Iowa? 12 Department of Agronomy Winter canola needs to form between at least five to maximize potential winter survival. 7-8 leaves 11-9 leaves 5-6 leaves 3-4 leaves (Lääniste et al., 2013) Department of Agronomy Convention: plant six weeks before the first <-4.5 ºC frost (Boyles et al., 2012). • Conditions vary widely among locations and years. • Is this estimate relevant for Iowa? This is a healthy six-leaf rosette 14 Department of Agronomy Proposal: We could also estimate seeding dates using canola’s thermal-time requirement for developing at least five leaves. Emergence Site SOR 2012 BRU 2013 Seeding Date 31-­‐Aug 17-­‐Sep 1-­‐Oct 3-­‐Sep 13-­‐Sep 1-­‐Oct Median = Leaf development GDD to Emergence 223 181 129 345 156 156 168.5 15 Department of Agronomy What is thermal time? - Accumulation of temperature over time - Growing Degree Days (GDD) if Tmin< TBASE, then Tmin=TBASE; if Tmax< TBASE, then Tmax=TBASE; if Tmax >TMAX, then Tmax=TMAX; if Tmin > TMAX, then Tmin=TMAX. TBASE = 4.5ºC TMAX = 30ºC (Mcmaster and Wallace, 1997) 16 Department of Agronomy Using field data, we estimate that canola needs about 515 GDD to develop five leaves. Emergence Site SOR 2012 BRU 2013 Seeding Date 31-­‐Aug 17-­‐Sep 1-­‐Oct 3-­‐Sep 13-­‐Sep 1-­‐Oct Median = Leaf development GDD to Emergence 223 181 129 345 156 156 168.5 TTRoverwintering = 169 + 346 = 515 GDD 17 Department of Agronomy Calculating Latest Reliable Seeding Date (LRSD) Conventional method • Plant 42 days before the first frost Proposed method • Plant 515 GDD before the first frost !"#$ = ! !!!.!℃! − !! !"#$ = ! !!!.!℃! − !42! ! ∋ ! −! (!!!!"#$% ) == ! !!! ! ! !!.!℃ !! 18 Department of Agronomy Spatial Question Will these two methods produce different estimates for Iowa? 19 Department of Agronomy Weather data* form 1972-2011 at 110 stations was used for this analysis. - Daily observations of GDDs - Date of first -4.5ºC frost *Iowa Environmental Mesonet 20 Department of Agronomy Results from calculation 1. With the 40 year range, we obtain distributions of LRSD at every location. 2. From these distributions, we calculate the 10th, 50th and 90th percentiles (aka probability levels). 21 Department of Agronomy Interpretation of the probability levels • 0.1 Probability level: 90% of the times there is enough time • 0.5 Probability level: 50% of the times there is enough time • 0.9 Probability level: 10% of the times there is enough time 22 Department of Agronomy Yes, they lead us to different conclusions. 23 Department of Agronomy The conventional method tends to underestimate the thermal time available for growth in Iowa. Δmean = 2.4 Δmean =10.8 Δmean =17.5 Days 24 Department of Agronomy Spatial Question Which method produces better LRSD estimates? 25 Department of Agronomy Spatial Autocorrelation "Everything is related to everything else, but near things are more related than distant things." - W. Tobler (1970) 26 Department of Agronomy Voronoi maps reveal the how stationary are the LRSD estimates. 27 Department of Agronomy Ordinary Kriging produces prediction and error surfaces out sample points. Constant but unknown ! ! = !! + !!(!)! (Johnson, 2001) 28 Department of Agronomy The Z values are weighted linear combinations of the values of neighboring points. ! ! !! = ! !! !! !! ! !!! Can we know how good our predictions of Z are? ! !! ! = 1 <- make sure that predictions are unbiased ! 29 Department of Agronomy Variance Yes, by fitting a semivariance function… Semivariance measures how (dis)similar are two points in relation to distance. Semivariogram Covariogram Chen et al., (2012) Distance 30 Department of Agronomy Then we substitute the empirical semivariogram by a known function. Empirical Gaussian 1 ! ℎ =! ! 2!(ℎ) !(!) ![! !! − !!(!! + ℎ)]! !!! ! ℎ = ! !! + ! 1 − !"# −! !!! ! !! ; 31 Department of Agronomy Removing spatial trends ensures that the mean is constant and data are normal. Conventional method LRSD Global Polynomial Interpolation residuals 32 Department of Agronomy Removing spatial trends ensures that the mean is constant and data are normal. Proposed method LRSD Global Polynomial Interpolation residuals 33 Department of Agronomy OK interpolations were fitted to the LRSDs calculated by both methods. LRSD calculation method Probability Interpolation Method Trend Order of trend Trend type Trend Removal Transformation Searching Neighborhood Neighbors to include Include at least ! Sector type Semiaxis (m) Semivariogram Number of lags Lag size (m) Nugget Model Type Range (m) Anisotropy Partial sill 0.1 Conventional 0.5 0.9 0.1 Proposed 0.5 0.9 OK OK OK OK OK OK 1st Global Yes None 2nd Global Yes None 2nd Global Yes None 2nd Global Yes None 2nd Global Yes None 2nd Global Yes None 15 10 15 10 15 10 Four and 45° Four and 45° 110,744 15 10 Four and 45° 70,633 79,531 67,445 15 10 Four and 45° 67,445 15 10 Four and 45° 67,445 12 13,843 26.64 Gaussian 110,744 No 7.09 12 9,565 17.17 Gaussian 70,633 No 6.40 12 9,062 22.06 Gaussian 79,531 No 5.17 8 14,000 9.04 Gaussian 67,445 No 2.67 12 8,431 4.95 Gaussian 67,445 No 2.65 12 8,431 2.80 Gaussian 67,445 No 2.38 Four 34 Department of Agronomy Errors were the lowest with the proposed method at the 0.5 and 0.9 probability levels. LRSD calculation method Probability Conventional 0.1 0.5 0.9 0.1 Proposed 0.5 0.9 Prediction Errors RMSE MSE RMSSE ASE 5.71 -0.014 1.016 5.60 4.80 -0.004 1.006 4.76 5.21 -0.002 1.007 5.17 3.39 -0.001 1.000 3.40 2.67 -0.002 1.000 2.67 2.13 -0.001 0.991 2.14 Predicted vs Measured Regression Equation Slope Intercept 0.30 168.9 0.43 150.6 0.42 160.0 0.59 97.8 0.73 68.2 0.79 51.9 ! 35 Department of Agronomy The proposed method was better suited for OK interpolation. Conventional prediction std error prediction Proposed std error 36 Department of Agronomy Conclusions on Methods Conventional Method • Underestimates the actual thermal-time required for development • Estimates have poor spatial structure • OK prediction errors are relatively larger Proposed Method • Based on time and temperature • Estimates are relatively more stationary • OK prediction errors are relatively lower 37 Department of Agronomy Research Question How late can we plant winter canola to achieve sufficient growth and winter survival in Iowa? 38 Department of Agronomy To create a seeding date atlas, the lower 95% confidence interval was calculated using the proposed 0.5 probability rasters. prediction std error !"#$!"#!$ = !!! − 1.96 ∗ !" 39 Department of Agronomy 40 Department of Agronomy Weaknesses • • • Winter kill can still happen despite of good growth achieved in the fall Will the next 40 years be on average similar to 1972 – 2011? Growth data used is to estimate TTR is scant (one cultivar, two years) 41 Department of Agronomy Next steps • • • Compute county average values so they can be used in the Cover Crop Decision Tool Increase the confidence in the TTR by incorporating more field and cultivar data Expand this analysis to other areas of the Midwest and to other crops 42 Department of Agronomy Thank you! • Questions? Rafael Martinez-Feria rmartine@iastate.edu 1021 Agronomy Hall Ames, IA 50011 43 Department of Agronomy 44 Department of Agronomy
