STAT 510 Homework 12 Due Date: 11:00 A.M., Wednesday, April 27
advertisement
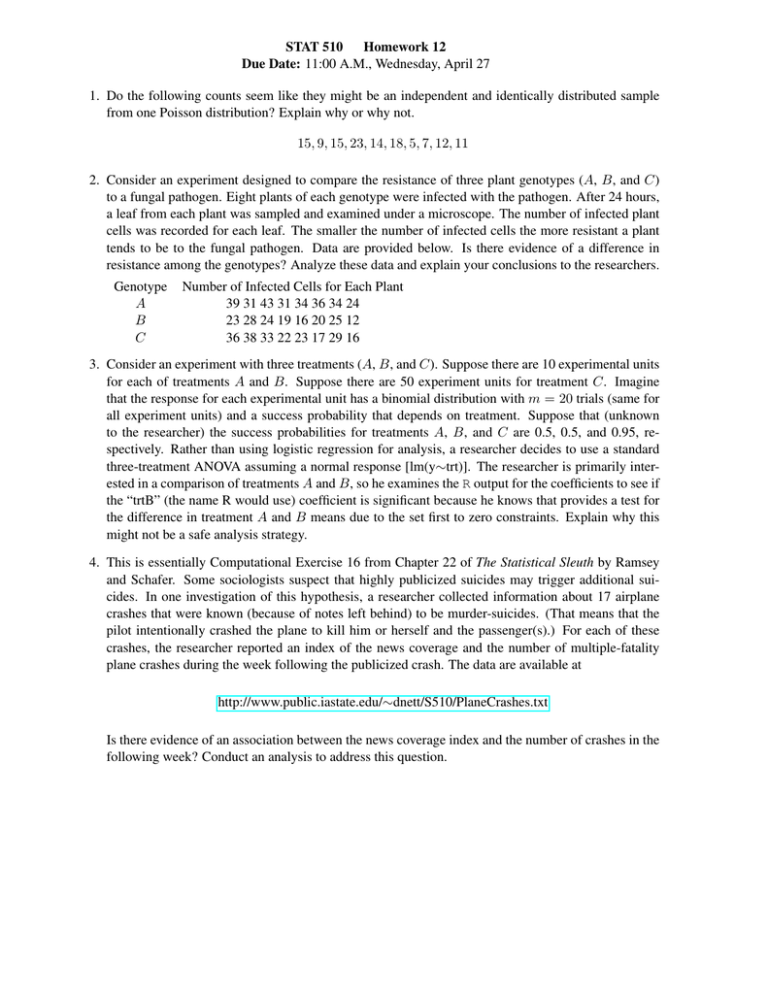
STAT 510 Homework 12 Due Date: 11:00 A.M., Wednesday, April 27 1. Do the following counts seem like they might be an independent and identically distributed sample from one Poisson distribution? Explain why or why not. 15, 9, 15, 23, 14, 18, 5, 7, 12, 11 2. Consider an experiment designed to compare the resistance of three plant genotypes (A, B, and C) to a fungal pathogen. Eight plants of each genotype were infected with the pathogen. After 24 hours, a leaf from each plant was sampled and examined under a microscope. The number of infected plant cells was recorded for each leaf. The smaller the number of infected cells the more resistant a plant tends to be to the fungal pathogen. Data are provided below. Is there evidence of a difference in resistance among the genotypes? Analyze these data and explain your conclusions to the researchers. Genotype A B C Number of Infected Cells for Each Plant 39 31 43 31 34 36 34 24 23 28 24 19 16 20 25 12 36 38 33 22 23 17 29 16 3. Consider an experiment with three treatments (A, B, and C). Suppose there are 10 experimental units for each of treatments A and B. Suppose there are 50 experiment units for treatment C. Imagine that the response for each experimental unit has a binomial distribution with m = 20 trials (same for all experiment units) and a success probability that depends on treatment. Suppose that (unknown to the researcher) the success probabilities for treatments A, B, and C are 0.5, 0.5, and 0.95, respectively. Rather than using logistic regression for analysis, a researcher decides to use a standard three-treatment ANOVA assuming a normal response [lm(y∼trt)]. The researcher is primarily interested in a comparison of treatments A and B, so he examines the R output for the coefficients to see if the “trtB” (the name R would use) coefficient is significant because he knows that provides a test for the difference in treatment A and B means due to the set first to zero constraints. Explain why this might not be a safe analysis strategy. 4. This is essentially Computational Exercise 16 from Chapter 22 of The Statistical Sleuth by Ramsey and Schafer. Some sociologists suspect that highly publicized suicides may trigger additional suicides. In one investigation of this hypothesis, a researcher collected information about 17 airplane crashes that were known (because of notes left behind) to be murder-suicides. (That means that the pilot intentionally crashed the plane to kill him or herself and the passenger(s).) For each of these crashes, the researcher reported an index of the news coverage and the number of multiple-fatality plane crashes during the week following the publicized crash. The data are available at http://www.public.iastate.edu/∼dnett/S510/PlaneCrashes.txt Is there evidence of an association between the news coverage index and the number of crashes in the following week? Conduct an analysis to address this question.
![[INSTITUTIONAL/DEPARTMENTAL LETTERHEAD] DATE DEPARTMENT SITE NAME](http://s2.studylib.net/store/data/010624009_1-5df4519bb85841965de4eed96b009695-300x300.png)
