Stat 401 A XM ... On-Campus Due Date: Off-Campus Due Date:
advertisement
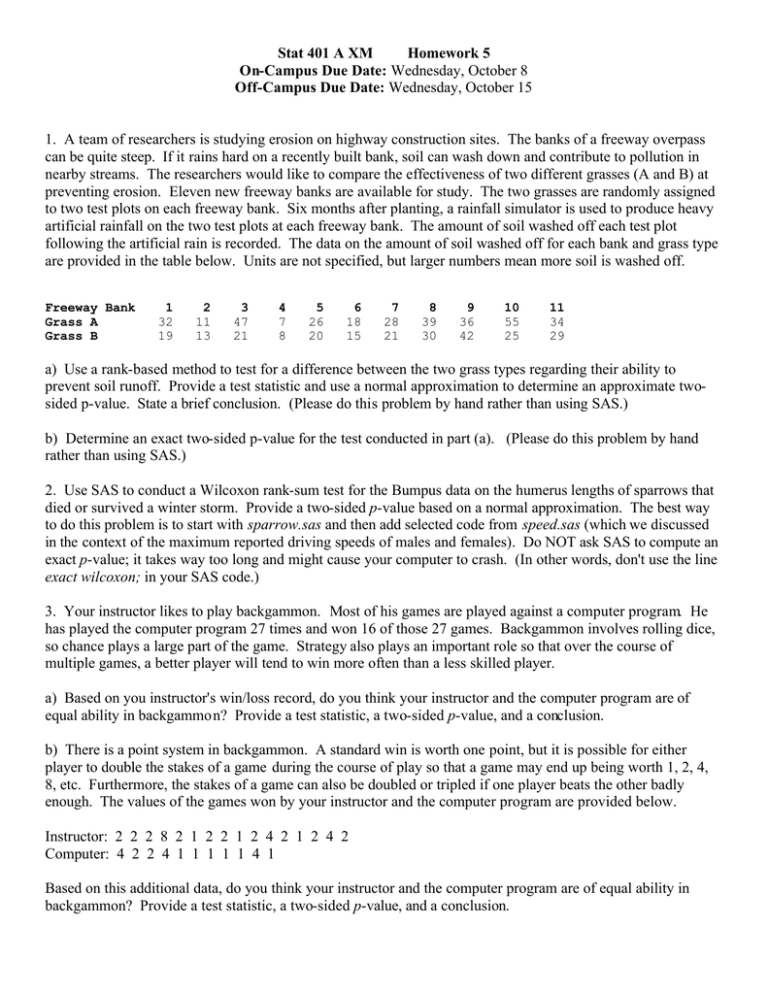
Stat 401 A XM Homework 5 On-Campus Due Date: Wednesday, October 8 Off-Campus Due Date: Wednesday, October 15 1. A team of researchers is studying erosion on highway construction sites. The banks of a freeway overpass can be quite steep. If it rains hard on a recently built bank, soil can wash down and contribute to pollution in nearby streams. The researchers would like to compare the effectiveness of two different grasses (A and B) at preventing erosion. Eleven new freeway banks are available for study. The two grasses are randomly assigned to two test plots on each freeway bank. Six months after planting, a rainfall simulator is used to produce heavy artificial rainfall on the two test plots at each freeway bank. The amount of soil washed off each test plot following the artificial rain is recorded. The data on the amount of soil washed off for each bank and grass type are provided in the table below. Units are not specified, but larger numbers mean more soil is washed off. Freeway Bank Grass A Grass B 1 32 19 2 11 13 3 47 21 4 7 8 5 26 20 6 18 15 7 28 21 8 39 30 9 36 42 10 55 25 11 34 29 a) Use a rank-based method to test for a difference between the two grass types regarding their ability to prevent soil runoff. Provide a test statistic and use a normal approximation to determine an approximate twosided p-value. State a brief conclusion. (Please do this problem by hand rather than using SAS.) b) Determine an exact two-sided p-value for the test conducted in part (a). (Please do this problem by hand rather than using SAS.) 2. Use SAS to conduct a Wilcoxon rank-sum test for the Bumpus data on the humerus lengths of sparrows that died or survived a winter storm. Provide a two-sided p-value based on a normal approximation. The best way to do this problem is to start with sparrow.sas and then add selected code from speed.sas (which we discussed in the context of the maximum reported driving speeds of males and females). Do NOT ask SAS to compute an exact p-value; it takes way too long and might cause your computer to crash. (In other words, don't use the line exact wilcoxon; in your SAS code.) 3. Your instructor likes to play backgammon. Most of his games are played against a computer program. He has played the computer program 27 times and won 16 of those 27 games. Backgammon involves rolling dice, so chance plays a large part of the game. Strategy also plays an important role so that over the course of multiple games, a better player will tend to win more often than a less skilled player. a) Based on you instructor's win/loss record, do you think your instructor and the computer program are of equal ability in backgammon? Provide a test statistic, a two-sided p-value, and a conclusion. b) There is a point system in backgammon. A standard win is worth one point, but it is possible for either player to double the stakes of a game during the course of play so that a game may end up being worth 1, 2, 4, 8, etc. Furthermore, the stakes of a game can also be doubled or tripled if one player beats the other badly enough. The values of the games won by your instructor and the computer program are provided below. Instructor: 2 2 2 8 2 1 2 2 1 2 4 2 1 2 4 2 Computer: 4 2 2 4 1 1 1 1 1 4 1 Based on this additional data, do you think your instructor and the computer program are of equal ability in backgammon? Provide a test statistic, a two-sided p-value, and a conclusion. 4. Commercial fertilizer contains nitrogen that helps to increase corn yield. Swine manure also contains high amounts of nitrogen. Much corn is grown each year in Iowa. Also large amounts of swine manure are produced each year in Iowa. Thus it makes sense to examine the effectiveness of using swine manure as a fertilizer for corn. Researchers conducted an experiment to evaluate the effectiveness of applying swine manure to soil both with and without applying commercial fertilizer. Three levels of manure were considered (none, low, high). Two levels of commercial fertilizer were considered (absent and present). A field was divided into 30 plots of land. Five plots were randomly assigned to each of 6 treatments in a completely randomized design. The six treatments can be described as follows. Treatment 1 2 3 4 5 6 Description no manure and no commercial fertilizer low manure and no commercial fertilizer high manure and no commercial fertilizer no manure with commercial fertilizer (commercial fertilizer only) low manure with commercial fertilizer high manure with commercial fertilizer Plots were treated in the spring and yields were recorded during the fall harvest. A summary of the grain yield data (in Mg/ha) is provided below. Treatment Number of plots Average Variance 1 5 8.3 2.6 2 5 11.3 3.3 3 5 14.0 3.1 4 5 11.0 3.3 5 5 13.9 2.9 6 5 14.1 2.8 a) Provide a one-way ANOVA table for this data. Include SOURCE, DF, SS, MS, and F columns in your table. b) Provide a p-value for the F-statistic associated with your ANOVA table, and explain briefly what this pvalue means in the context of this data.
![Questions for (3.3.3) Externalities in agriculture [True or False?] The](http://s2.studylib.net/store/data/009995147_1-f1de64b535b6f4b8fe06925685d00ca4-300x300.png)
