Document 10615322
advertisement

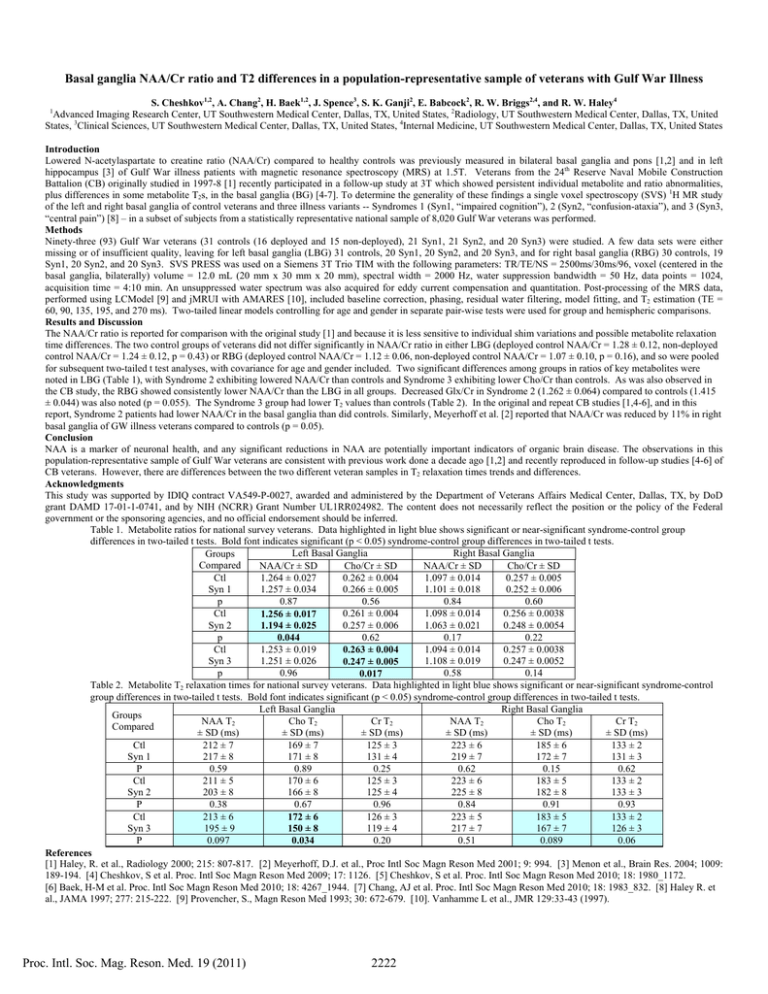
Basal ganglia NAA/Cr ratio and T2 differences in a population-representative sample of veterans with Gulf War Illness S. Cheshkov1,2, A. Chang2, H. Baek1,2, J. Spence3, S. K. Ganji2, E. Babcock2, R. W. Briggs2,4, and R. W. Haley4 Advanced Imaging Research Center, UT Southwestern Medical Center, Dallas, TX, United States, 2Radiology, UT Southwestern Medical Center, Dallas, TX, United States, 3Clinical Sciences, UT Southwestern Medical Center, Dallas, TX, United States, 4Internal Medicine, UT Southwestern Medical Center, Dallas, TX, United States 1 Introduction Lowered N-acetylaspartate to creatine ratio (NAA/Cr) compared to healthy controls was previously measured in bilateral basal ganglia and pons [1,2] and in left hippocampus [3] of Gulf War illness patients with magnetic resonance spectroscopy (MRS) at 1.5T. Veterans from the 24th Reserve Naval Mobile Construction Battalion (CB) originally studied in 1997-8 [1] recently participated in a follow-up study at 3T which showed persistent individual metabolite and ratio abnormalities, plus differences in some metabolite T2s, in the basal ganglia (BG) [4-7]. To determine the generality of these findings a single voxel spectroscopy (SVS) 1H MR study of the left and right basal ganglia of control veterans and three illness variants -- Syndromes 1 (Syn1, “impaired cognition”), 2 (Syn2, “confusion-ataxia”), and 3 (Syn3, “central pain”) [8] – in a subset of subjects from a statistically representative national sample of 8,020 Gulf War veterans was performed. Methods Ninety-three (93) Gulf War veterans (31 controls (16 deployed and 15 non-deployed), 21 Syn1, 21 Syn2, and 20 Syn3) were studied. A few data sets were either missing or of insufficient quality, leaving for left basal ganglia (LBG) 31 controls, 20 Syn1, 20 Syn2, and 20 Syn3, and for right basal ganglia (RBG) 30 controls, 19 Syn1, 20 Syn2, and 20 Syn3. SVS PRESS was used on a Siemens 3T Trio TIM with the following parameters: TR/TE/NS = 2500ms/30ms/96, voxel (centered in the basal ganglia, bilaterally) volume = 12.0 mL (20 mm x 30 mm x 20 mm), spectral width = 2000 Hz, water suppression bandwidth = 50 Hz, data points = 1024, acquisition time = 4:10 min. An unsuppressed water spectrum was also acquired for eddy current compensation and quantitation. Post-processing of the MRS data, performed using LCModel [9] and jMRUI with AMARES [10], included baseline correction, phasing, residual water filtering, model fitting, and T2 estimation (TE = 60, 90, 135, 195, and 270 ms). Two-tailed linear models controlling for age and gender in separate pair-wise tests were used for group and hemispheric comparisons. Results and Discussion The NAA/Cr ratio is reported for comparison with the original study [1] and because it is less sensitive to individual shim variations and possible metabolite relaxation time differences. The two control groups of veterans did not differ significantly in NAA/Cr ratio in either LBG (deployed control NAA/Cr = 1.28 ± 0.12, non-deployed control NAA/Cr = 1.24 ± 0.12, p = 0.43) or RBG (deployed control NAA/Cr = 1.12 ± 0.06, non-deployed control NAA/Cr = 1.07 ± 0.10, p = 0.16), and so were pooled for subsequent two-tailed t test analyses, with covariance for age and gender included. Two significant differences among groups in ratios of key metabolites were noted in LBG (Table 1), with Syndrome 2 exhibiting lowered NAA/Cr than controls and Syndrome 3 exhibiting lower Cho/Cr than controls. As was also observed in the CB study, the RBG showed consistently lower NAA/Cr than the LBG in all groups. Decreased Glx/Cr in Syndrome 2 (1.262 ± 0.064) compared to controls (1.415 ± 0.044) was also noted (p = 0.055). The Syndrome 3 group had lower T2 values than controls (Table 2). In the original and repeat CB studies [1,4-6], and in this report, Syndrome 2 patients had lower NAA/Cr in the basal ganglia than did controls. Similarly, Meyerhoff et al. [2] reported that NAA/Cr was reduced by 11% in right basal ganglia of GW illness veterans compared to controls (p = 0.05). Conclusion NAA is a marker of neuronal health, and any significant reductions in NAA are potentially important indicators of organic brain disease. The observations in this population-representative sample of Gulf War veterans are consistent with previous work done a decade ago [1,2] and recently reproduced in follow-up studies [4-6] of CB veterans. However, there are differences between the two different veteran samples in T2 relaxation times trends and differences. Acknowledgments This study was supported by IDIQ contract VA549-P-0027, awarded and administered by the Department of Veterans Affairs Medical Center, Dallas, TX, by DoD grant DAMD 17-01-1-0741, and by NIH (NCRR) Grant Number UL1RR024982. The content does not necessarily reflect the position or the policy of the Federal government or the sponsoring agencies, and no official endorsement should be inferred. Table 1. Metabolite ratios for national survey veterans. Data highlighted in light blue shows significant or near-significant syndrome-control group differences in two-tailed t tests. Bold font indicates significant (p < 0.05) syndrome-control group differences in two-tailed t tests. Left Basal Ganglia Right Basal Ganglia Groups Compared NAA/Cr ± SD Cho/Cr ± SD NAA/Cr ± SD Cho/Cr ± SD Ctl 1.264 ± 0.027 0.262 ± 0.004 1.097 ± 0.014 0.257 ± 0.005 Syn 1 1.257 ± 0.034 0.266 ± 0.005 1.101 ± 0.018 0.252 ± 0.006 p 0.87 0.56 0.84 0.60 Ctl 0.261 ± 0.004 1.098 ± 0.014 0.256 ± 0.0038 1.256 ± 0.017 Syn 2 0.257 ± 0.006 1.063 ± 0.021 0.248 ± 0.0054 1.194 ± 0.025 0.62 0.17 0.22 p 0.044 1.094 ± 0.014 0.257 ± 0.0038 Ctl 1.253 ± 0.019 0.263 ± 0.004 1.108 ± 0.019 0.247 ± 0.0052 Syn 3 1.251 ± 0.026 0.247 ± 0.005 0.58 0.14 p 0.96 0.017 Table 2. Metabolite T2 relaxation times for national survey veterans. Data highlighted in light blue shows significant or near-significant syndrome-control group differences in two-tailed t tests. Bold font indicates significant (p < 0.05) syndrome-control group differences in two-tailed t tests. Left Basal Ganglia Right Basal Ganglia Groups NAA T2 Cho T2 Cr T2 NAA T2 Cho T2 Cr T2 Compared ± SD (ms) ± SD (ms) ± SD (ms) ± SD (ms) ± SD (ms) ± SD (ms) Ctl 212 ± 7 169 ± 7 125 ± 3 223 ± 6 185 ± 6 133 ± 2 Syn 1 217 ± 8 171 ± 8 131 ± 4 219 ± 7 172 ± 7 131 ± 3 P 0.59 0.89 0.25 0.62 0.15 0.62 Ctl 211 ± 5 170 ± 6 125 ± 3 223 ± 6 183 ± 5 133 ± 2 Syn 2 203 ± 8 166 ± 8 125 ± 4 225 ± 8 182 ± 8 133 ± 3 P 0.38 0.67 0.96 0.84 0.91 0.93 Ctl 213 ± 6 183 ± 5 133 ± 2 126 ± 3 223 ± 5 172 ± 6 195 ± 9 167 ± 7 126 ± 3 Syn 3 119 ± 4 217 ± 7 150 ± 8 0.20 0.51 P 0.097 0.089 0.06 0.034 References [1] Haley, R. et al., Radiology 2000; 215: 807-817. [2] Meyerhoff, D.J. et al., Proc Intl Soc Magn Reson Med 2001; 9: 994. [3] Menon et al., Brain Res. 2004; 1009: 189-194. [4] Cheshkov, S et al. Proc. Intl Soc Magn Reson Med 2009; 17: 1126. [5] Cheshkov, S et al. Proc. Intl Soc Magn Reson Med 2010; 18: 1980_1172. [6] Baek, H-M et al. Proc. Intl Soc Magn Reson Med 2010; 18: 4267_1944. [7] Chang, AJ et al. Proc. Intl Soc Magn Reson Med 2010; 18: 1983_832. [8] Haley R. et al., JAMA 1997; 277: 215-222. [9] Provencher, S., Magn Reson Med 1993; 30: 672-679. [10]. Vanhamme L et al., JMR 129:33-43 (1997). Proc. Intl. Soc. Mag. Reson. Med. 19 (2011) 2222


