Wavelet Reminder Sheet
advertisement
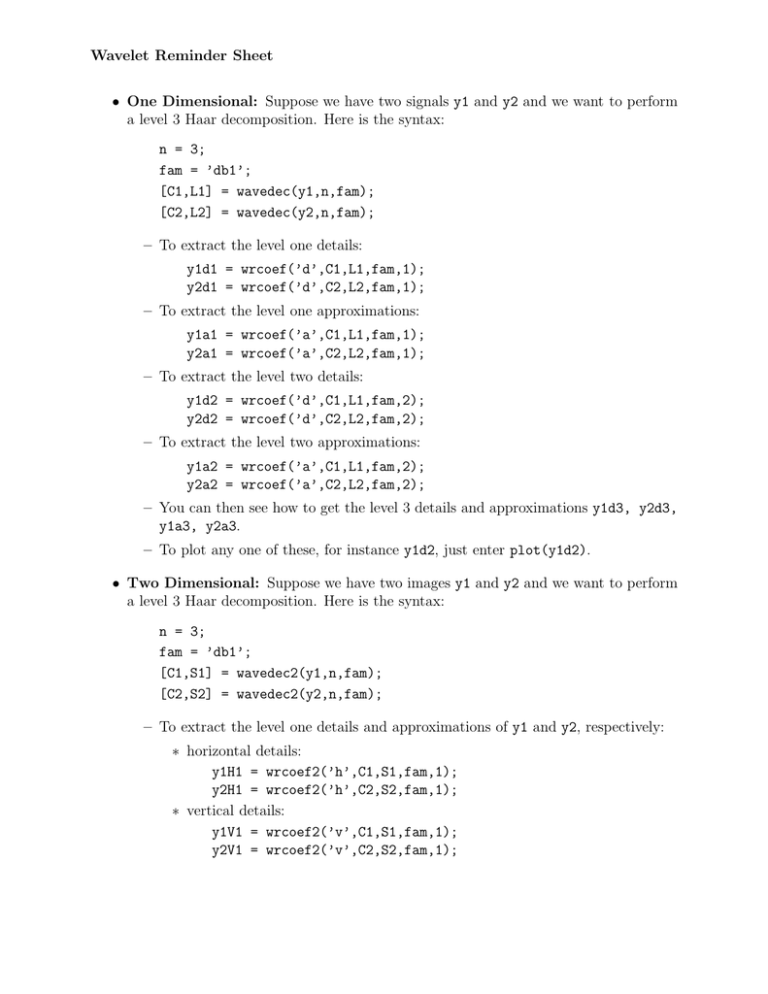
Wavelet Reminder Sheet • One Dimensional: Suppose we have two signals y1 and y2 and we want to perform a level 3 Haar decomposition. Here is the syntax: n = 3; fam = ’db1’; [C1,L1] = wavedec(y1,n,fam); [C2,L2] = wavedec(y2,n,fam); – To extract the level one details: y1d1 = wrcoef(’d’,C1,L1,fam,1); y2d1 = wrcoef(’d’,C2,L2,fam,1); – To extract the level one approximations: y1a1 = wrcoef(’a’,C1,L1,fam,1); y2a1 = wrcoef(’a’,C2,L2,fam,1); – To extract the level two details: y1d2 = wrcoef(’d’,C1,L1,fam,2); y2d2 = wrcoef(’d’,C2,L2,fam,2); – To extract the level two approximations: y1a2 = wrcoef(’a’,C1,L1,fam,2); y2a2 = wrcoef(’a’,C2,L2,fam,2); – You can then see how to get the level 3 details and approximations y1d3, y2d3, y1a3, y2a3. – To plot any one of these, for instance y1d2, just enter plot(y1d2). • Two Dimensional: Suppose we have two images y1 and y2 and we want to perform a level 3 Haar decomposition. Here is the syntax: n = 3; fam = ’db1’; [C1,S1] = wavedec2(y1,n,fam); [C2,S2] = wavedec2(y2,n,fam); – To extract the level one details and approximations of y1 and y2, respectively: ∗ horizontal details: y1H1 = wrcoef2(’h’,C1,S1,fam,1); y2H1 = wrcoef2(’h’,C2,S2,fam,1); ∗ vertical details: y1V1 = wrcoef2(’v’,C1,S1,fam,1); y2V1 = wrcoef2(’v’,C2,S2,fam,1); ∗ diagonal details: y1D1 = wrcoef2(’d’,C1,S1,fam,1); y2D1 = wrcoef2(’d’,C2,S2,fam,1); ∗ approximations: y1A1 = wrcoef2(’a’,C1,S1,fam,1); y2A1 = wrcoef2(’a’,C2,S2,fam,1); – To extract the level two details and approximations of y1 and y2, respectively: ∗ horizontal details: y1H2 = wrcoef2(’h’,C1,S1,fam,2); y2H2 = wrcoef2(’h’,C2,S2,fam,2); ∗ vertical details: y1V2 = wrcoef2(’v’,C1,S1,fam,2); y2V2 = wrcoef2(’v’,C2,S2,fam,2); ∗ diagonal details: y1D2 = wrcoef2(’d’,C1,S1,fam,2); y2D2 = wrcoef2(’d’,C2,S2,fam,2); ∗ approximations: y1A2 = wrcoef2(’a’,C1,S1,fam,2); y2A2 = wrcoef2(’a’,C2,S2,fam,2); – You can now see how to extract the level 3 details and approximations. – To plot any one of these, first enter just one time: map = [ 1 1 1; 0 0 0 ]; Then for any detail or approximation you wish to plot, for instance y2V2, enter image(y2V2);colormap(map); You do not need to enter map again.

