Benchmark for measurements in a planar diffuser with a high...
advertisement
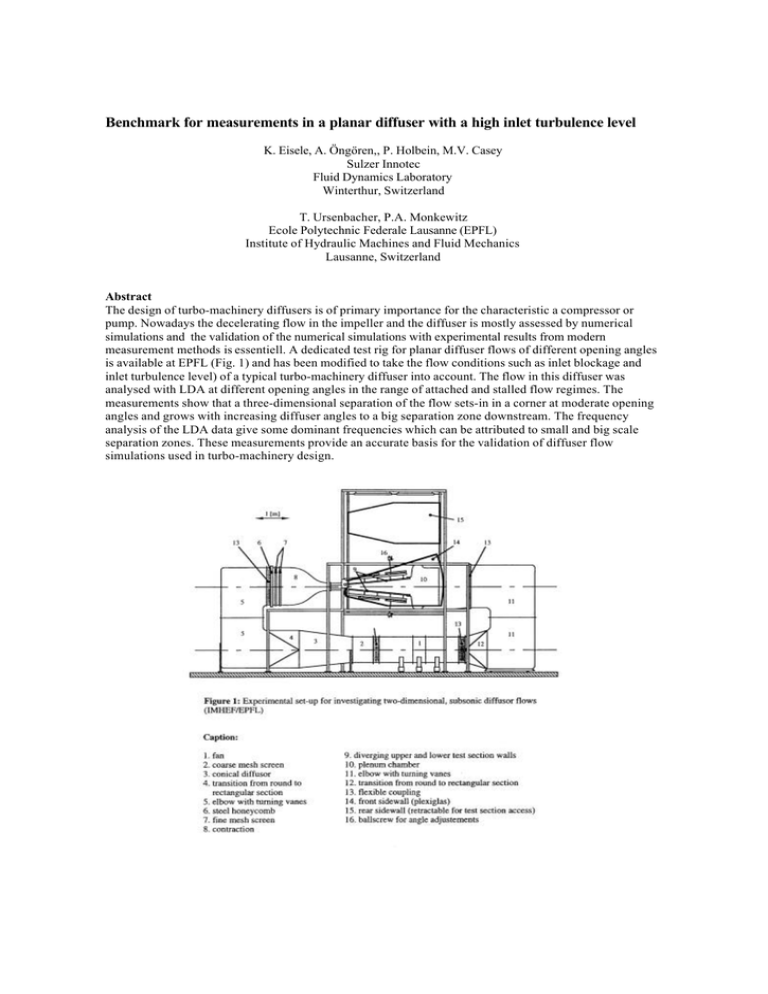
Benchmark for measurements in a planar diffuser with a high inlet turbulence level K. Eisele, A. Öngören,, P. Holbein, M.V. Casey Sulzer Innotec Fluid Dynamics Laboratory Winterthur, Switzerland T. Ursenbacher, P.A. Monkewitz Ecole Polytechnic Federale Lausanne (EPFL) Institute of Hydraulic Machines and Fluid Mechanics Lausanne, Switzerland Abstract The design of turbo-machinery diffusers is of primary importance for the characteristic a compressor or pump. Nowadays the decelerating flow in the impeller and the diffuser is mostly assessed by numerical simulations and the validation of the numerical simulations with experimental results from modern measurement methods is essentiell. A dedicated test rig for planar diffuser flows of different opening angles is available at EPFL (Fig. 1) and has been modified to take the flow conditions such as inlet blockage and inlet turbulence level) of a typical turbo-machinery diffuser into account. The flow in this diffuser was analysed with LDA at different opening angles in the range of attached and stalled flow regimes. The measurements show that a three-dimensional separation of the flow sets-in in a corner at moderate opening angles and grows with increasing diffuser angles to a big separation zone downstream. The frequency analysis of the LDA data give some dominant frequencies which can be attributed to small and big scale separation zones. These measurements provide an accurate basis for the validation of diffuser flow simulations used in turbo-machinery design. Introduction The characteristics and the performance of a compressor or pump are determined principally by the fluid dynamics of the decelerating flow in the impeller and diffuser /1,2/ and the optimal aerodynamic design of the diffusing passages, taking into account the highly unsteady and turbulent nature of the flow is of primary importance. The complex and unsteady behaviour of the diffuser flow in turbo machines is caused by the interaction of the rotating impeller with the non-rotating diffuser vanes. This interaction phenomena has been investigated numerically and experimentally in a vast number of studies during the past decade, providing high quality input necessary for accurate numerical simulations of unsteady or steady diffuser flows /3,4/. However, the comparison of the results of these simulations with experiments showed that the accuracy of the numerical simulations need to be further improved with the help of the latest experimental techniques. In /2/, typical results of the simulations of a two-dimensional planar diffuser have been presented. The comparison of these simulations with the measurements of Reneau et al. /5/ has shown that an improvement of the numerical simulations are necessary for a reliable diffuser design. In the present study, detailed flow measurements in a planar diffuser with well-defined inlet and boundary conditions have been carried out using modern measurement tools such as high accuracy pressure measurements and Laser Doppler Anemometry . The goal of these experiments is to obtain reliable data for the validation and improvement of numerical simulations of typical diffusers of turbo-machines. Experimental Setup The facilities of the Institute of Hydraulic Machines and Fluid Mechanics (EPFL), consisting of a closedreturn wind tunnel with a planar diffuser of variable opening angle, was utilised in this study (Fig. 1; see also /6/). The main characteristics of this diffuser are given in table 1. Note that the lenght to inlet width ratio is typical of that found in many diffusing passages of pumps and compressors. Geometry Dim. Length to inlet width ratio L/D Opening angle deg α Inlet height H mm Width D mm Maximum speed UMax m/s Reynolds number: ReD Turbulence level: Tu Relative blockage d Table 1: EPFL-Diffuser Characteristic Value 6 0....30 250 800 30 500000 0.005 0.02 The setting of the angles of the two diffuser plates ca be adjusted with an accuracy better than 1/10 minute which corresponds to a pressure error < 0.1%. The reference pressure as well as the reference velocity was monitored with a 5-hole probe in the middle of the inlet channel. During all the measurements the wind tunnel was controlled such as to keep the Reynolds number constant at Re=500,000. The air temperature in the wind tunnel varied only very slightly so that the changes in the reference velocity was less than 0.2% during all experiments. This means that the wind tunnel is constant enough to perform very accurate pressure and velocity measurements, which are necessary for experimental benchmark data. The EPFL close circuit wind tunnel originally possessed a very low turbulence level and a relatively thin boundary layer thickness at the diffuser inlet due to the strong contraction at the upstream of the test section. In order to simulate the typical inlet conditions of a turbo-machinery diffuser, the low turbulence level of the wind tunnel had to be increased to a value of 5 to 8% at the diffuser inlet /1,7/ (see Table 1). The required turbulence level with a thick inlet boundary layer was obtained by mounting grids of various sizes and configurations at the end of the contraction (Fig. 2). These grids were designed and tested according to the guidelines given in /8/. The adequacy of the resulting boundary layer thickness and the turbulence level were confirmed with extensive hot wire anemometer measurements during preliminary tests. Prior to the LDA measurements, wall pressures at the top and bottom diffuser plates were recorded at nine different diffuser angles: α=2,3,4,5,6,7, 8,9,10°. The pressure rise in the flow direction was measured at 48 positions on each diffuser plate. A two-colour fibre LDA was used for the measurements. The probe was fixed on a special traversing system, which was controlled by a PC. The LDA measurements were performed through the parallel walls of the wind tunnel for different diffuser angles ( α=2,6,8,10°). The two parallel walls were made of perspex with high quality glass windows, which provided the optical access for the LDA. To ensure a uniform seeding in the flow, the flow was seeded downstream of the diffuser with a PALAS APG10 particle generator producing oil droplets of less than 1µm diameter. . Results A typical inlet profile measured on the bottom plate is given in Fig 3. It shows that the boundary layer profile had no inflection point and therefore, is expected to be stable on the basis of inviscid theory. The corresponding turbulence intensity distribution in the boundary layer has a slight s-shape as observed also in this figure. It is interesting to note that the pressure measurements indicate a slightly asymmetric pressure rise on the top and bottom diffuser plates, as seen in Fig 4. The dimensionless pressure recovery coefficient, cp, is calculated according to the relation : cp = ∆p ρ 2C (1) 2 reference where, ∆p is the pressure drop from the inlet to the outlet of the diffuser, ρ is the air density and Cref is the reference velocity. Here, the reference velocity is taken as the velocity measured at one point in the middle of the diffuser inlet. The cp values calculated from the measurements of this study are determined to be significantly lower than those measured by Reneau et al. in the literature /5/. The comparison of a typical case of the present study with those of Reneau et al. is given for a diffuser angle of 10 degrees in Fig. 5 It should be mentioned that the cp values given by Reneau et al. were calculated with the volumetric mean velocity. On the other hand, when the measured actual blockage is taken into consideration in the calculation of cp values , the pressure rise in the Reneau diffuser appears to be even higher than that in the modified EPFL diffuser. The reason for this latter difference can be attributed to the high turbulence level of nearly 8% in this diffuser (Fig. 2). The LDA measurements were performed in 4 planes perpendicular to the main flow direction and along 6 lines from the top to the bottom plates including the boundary layer (Table 2). In each plane and on each line, the stream-wise and the cross-stream velocity components were determined at about 300 measurement locations. In addition, the velocity component parallel to the wall was measured in the boundary layers of both diffuser plates. The measurement results shown in the 4 planes of Fig. 6-9 represent mean values of more than 5000 samples. The measurements along the lines represent more than 20000 samples. The large amount of data collected allows accurate spectral analysis to be carried out. The measurement time for each measurement lies in the range between 10 to 200 sec. Measurement planes Measurement lines X= (mm)* X, Z =(mm) X= 140 X=198, Z=0, 180* X= 340 X=598, Z=0, 180 X= 540 X=798, Z=0, 180 X= 840 X=0 Diffuser Inlet Z=0, Midplane Table 2: Measurement regions The velocity measurements with LDA show, that the velocity fields along the top and bottom diffuser plates are also asymmetric (Fig. 6-9). The flow is slightly biased towards the top diffuser plate and as the diffuser angle is increased the flow separation first sets-in on the bottom plate. The onset of the separation starts at 6 degrees in the last LDA plane. As observed in Fig. 7, the separation begins as a corner vortex on the right bottom corner. This vortex grows and separates from the corner as it moves towards the diffuser centre. At a diffuser angle of 10 degrees, a reverse flow begins at the first measurement plane in the bottom corner. The core of the corner vortex is clearly marked by the high fluctuation (rms) values at 6,8 and 10 degrees (7-9). The spectral analysis of the data belonging to the measurements at a distance of 40 mm from both the bottom and the top plates, indicates that no separation occurs at an opening of 2 degrees. Only broadband turbulence is observed with a very low spectral power level (Fig. 10). At an opening angle of 6 degrees the level of the power increases and near the diffuser outlet a high frequency peak around ~ 8 Hz is observed (Fig 11). At opening angles of 8 and 10 degrees a strong separation occurs near the bottom plate appearing as a peak in the spectra (Fig. 12, 14). From the dominant frequencies (~1 Hz), it can be assumed that the backward facing step at the diffuser outlet plays a dominant role for the separation. The detailed frequency analysis of the present LDA measurements were compared with those of the previous investigations on transitory stall in two dimensional diffusers /9, 10/ From these investigations a stall frequency between 0.01- 1. Hz is predicted for similar configurations. All spectra measured in this study contain such low frequency components. Conclusions The EPFL test rig has been found to be optimally suited for detailed flow analysis in a planar diffuser. The test rig is equipped with a high-accuracy pressure measuring system. The probe positioning system, together with the good optical access to the test section allow high quality laser anemometer measurements. Such experimental data provide the basis for improving the accuracy of numerical simulations which may lead to a better understanding of diffuser flows in both the attached and stalled regimes. The detailed flow analysis carried out in this study shows that the characteristics of separation and its time behaviour observed in the experiments depend on the small details of the test rig design used. Although the geometry is nominally two-dimensional the observed flow patterns are highly three-dimensional. Therefore, an accurate diffuser flow simulation and it’s comparison with the measurements may only be accomplished when all the geometric details of the test rig and the flow conditions are taken into consideration in the diffuser simulations. References /1/ Eisele K., et al, (1994): Flow analysis in a pump diffuser, Part 1: LDA and PTV measurements on the unsteady flow. J. of Fluids Engineering, Vol. 119 pp.968-977 /2/ Muggli F., etal., (1994): Flow analysis in a pump diffuser, Part 2: Validation of a CFD Code for steady flow. J. of Fluids Engineering, Vol. 119 pp.977-986 /3/ Casartelli, E., (1999): Dreidimensionale Diffusorströmung im Radialverdichter, numerisch untersucht. Dis ETH-Nr. 13056 Zürich 1999. /4/ Muggli, F., et al. (1996): Unsteady flow in the vaned diffuser of a medium specific speed pump. ASME-95GT-157, Birmingham 1996. /5/ Reneau, L.R., J.P. Johnston and S.J. Kline, (1996): Performance and Design of straight, twodimensional diffusers. ASME J. of Basic Engineerin, 1967, pp141-150. /6/ Truong T.V., Ph. Pulvin, (1989): Influence of wall riblets on diffuser flow. Applied Scientific Research. Vol 46, 1989, pp. 217-227. /7/ Stahlecker, D., (1999): Untersuchung der instationären Strömung eines beschaufelten Radialverdichter-diffusors mit einem Laser-Doppler-Anemometer. Dis. ETH-Nr.13228 Zürich 1999. /8/ Goldstein, S.: Modern Developments in Fluid Dynamics, Volume 1, Dover, ISBN 0-486-61357-7 /9/ Smith, C.R:, S.J. Kline, (1974): An experimental investigation of the transitioning stall regime in 2DDiffusers. ASME, J. of Fluids Engineering, Vol 96 (1974), pp. 11-18. /10/ Kwong, H.M., A:P: Dowling, (1994): Unsteady Flow in Diffusers. Transactions of the ASME. Vol 116, Dec. 1994, pp. 842-847 1,4 14 1,2 12 1 10 0,8 8 0,6 6 0,4 0 Fig. 2: Photo of the test section with the turbulence generating grid 120 400 100 80 60 40 20 0 -20 20 40 60 80 Y (mm) 100 120 4 140 Fig. 3: Inlet velocity profile on the bottom plate measured with a hot wire anemometer (HWA) P (Pas) Bottom plate 300 0,7 200 0,65 100 J 0 -100 J J -300 J 0,5 J J -100 100 Diffuser Inlet 300 500 X (mm) 700 900 1100 0,4 Top plate 300 0,45 B 400 100 0,3 B 0,25 -200 0,2 0 -300 -100 100 300 500 X (mm) 700 900 B B B B B 0 -100 B B J 0,35 200 -400 -300 J 0,55 -200 -400 -300 J 0,6 1 2 3 B EPFL J Reneau 4 5 6 Angle (deg) 7 8 9 10 1100 Fig. 4: Pressure rise along the two diffuser plates Fig. 5: Dimensionless pressure coefficient EPFL: Reference velocity, Reneau: Volumetric velocity Fig. 6: Diffuser Angle 2°: Mean velocity Rms-Values Fig. 7: Diffuser Angle 6°: Mean velocity Rms-Values Fig. 8: Diffuser Angle 8°: Mean velocity Rms-Values Fig. 9: Diffuser Angle 10°: Mean velocity Rms-Values Bottom plate Top plate Spectrum [PDA U1] [x²/Hz] Spectrum [PDA U1] [x²/Hz] 0.10 0.10 0.08 0.08 0.06 0.06 0.04 0.04 0.02 0.02 0.00 0.00 1 10 100 1 Frequency [Hz] 10 100 Frequency [Hz] Fig. 10: Spectra at an opening angle of 2°, Diffuser outlet X=798 mm Spectrum [PDA U1] [x²/Hz] Spectrum [PDA U1] [x²/Hz] 0.5 0.5 0.4 0.4 0.3 0.3 0.2 0.2 0.1 0.1 0.0 0.0 1 10 1 100 10 100 Frequency [Hz] Frequency [Hz] Fig. 11: Spectra at an opening angle of 6°, Diffuser outlet X=598 mm, Z=0.0 mm Spectrum [PDA U1] [x²/Hz] Spectrum [PDA U1] [x²/Hz] 0.5 0.5 0.4 0.4 0.3 0.3 0.2 0.2 0.1 0.1 0.0 0.0 1 10 100 1 Frequency [Hz] 10 100 Frequency [Hz] Fig. 12: Spectra at an opening angle of 8°, Diffuser outlet X=798 mm, Z=0.0 Spectrum [PDA U1] [x²/Hz] Spectrum [PDA U1] [x²/Hz] 1.2 1.2 1.0 1.0 0.8 0.8 0.6 0.6 0.4 0.4 0.2 0.2 0.0 0.0 1 1 10 100 10 Frequency [Hz] Frequency [Hz] Fig. 13: Spectra at an opening angle of 10°, Diffuser outlet X=798 mm, Z=0.0 100
