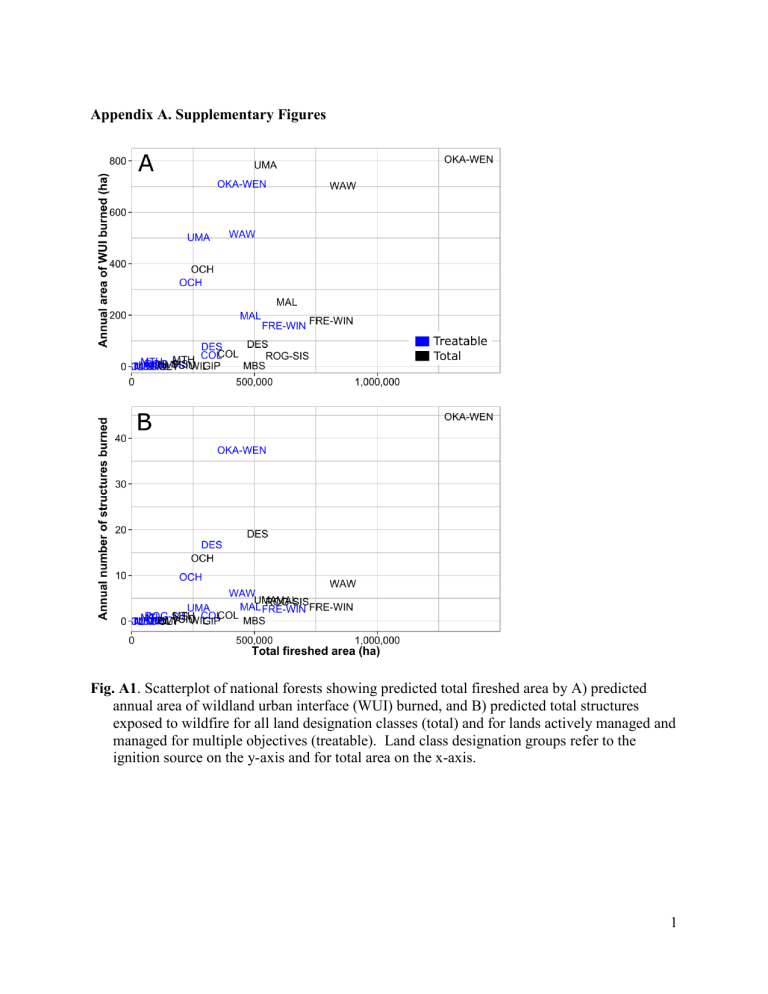
annual area of wildland urban interface (WUI) burned, and B)... exposed to wildfire for all land designation classes (total) and... Appendix A. Supplementary Figures
Appendix A. Supplementary Figures
Fig. A1 . Scatterplot of national forests showing predicted total fireshed area by A) predicted annual area of wildland urban interface (WUI) burned, and B) predicted total structures exposed to wildfire for all land designation classes (total) and for lands actively managed and managed for multiple objectives (treatable). Land class designation groups refer to the ignition source on the y-axis and for total area on the x-axis.
1
Fig. A2 . Landscape treatment strategies for different fuel management objectives. Strategies are determined by fire regime, fire management objectives, and the spatial pattern of values at risk. Black shaded areas in the maps depict fuel treatment areas within the example landscape. (A) Low hazard fire containers for dry forest restoration, (B) protection of
dispersed values using the approach of (Finney, 2007) where treatments are arranged to
maximize the reduction in spread rate, (C) defensible fuel breaks around a wildland urban interface (WUI), (D) defensible fuel breaks around dispersed values (e.g., critical wildlife habitat), (E) restoration of natural fire barriers (e.g., hardwood forest in a conifer matrix), and
(F) high hazard fire containers surrounded by networks of defensible fuel breaks. Figure
References
Ager, A. A., Vaillant, N. M., and McMahan, A. (2013). Restoration of fire in managed forests: a model to prioritize landscapes and analyze tradeoffs. Ecosphere , 4 (2), 29.
Finney, M. A. (2007). A computational method for optimizing fuel treatment location.
International Journal of Wildland Fire , 16 , 702-711.
2


