The 2005 HST Calibration Workshop
Space Telescope Science Institute, 2005
A. M. Koekemoer, P. Goudfrooij, and L. L. Dressel, eds.
Calibration and Interpretation of STIS Imaging Mode Fluxes
Charles R. Proffitt1
Science Programs, Computer Sciences Corporation, Baltimore, MD 21218
Abstract. While primarily a spectroscopic instrument, STIS also had a number
of imaging modes, many of which provided unique capabilities. However, most of
the STIS imaging modes also had very wide and non-standard passbands, making
calibration and interpretation of STIS imaging data especially challenging. Here we
describe the methods used to derive the adopted throughput curves, zero points, and
aperture corrections for these modes. The wide, non-standard passbands of STIS
imaging modes also present special challenges when comparing with observations in
other photometric systems. We discuss the relationship between STIS magnitudes
and colors and those of other common photometric systems.
1.
STIS Imaging Throughput Time Dependence and Zero Points.
The STIS instrument has three detectors, a CCD sensitive from ∼ 2000 to 10300 Å, a
Cs2 Te Multi-Anode Microchannel Array (MAMA) detector (1600 to 3100 Å) and a solarblind CsI MAMA (1150 to 1700 Å). Sensitivities of these detectors have varied over time.
For a given detector these changes depend on wavelength, but appear to be independent of
the mode. So for imaging observations we adopt the same time dependence vs. wavelength
that was determined for the first order spectroscopic modes by Stys et al. (2004). This
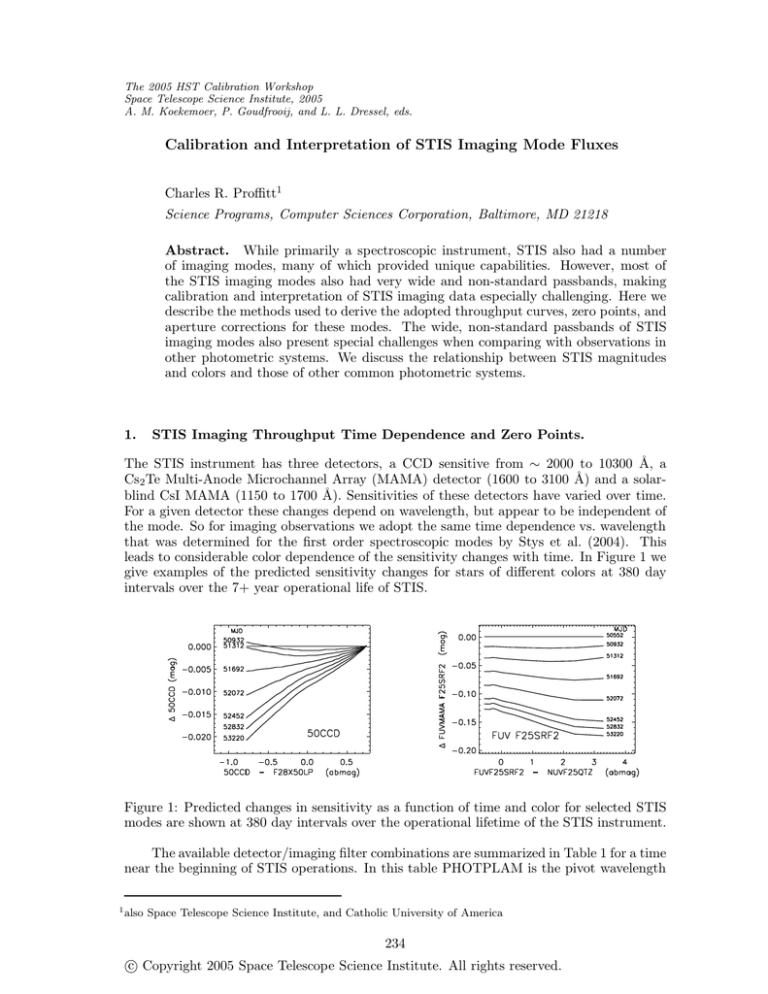
leads to considerable color dependence of the sensitivity changes with time. In Figure 1 we
give examples of the predicted sensitivity changes for stars of different colors at 380 day
intervals over the 7+ year operational life of STIS.
Figure 1: Predicted changes in sensitivity as a function of time and color for selected STIS
modes are shown at 380 day intervals over the operational lifetime of the STIS instrument.
The available detector/imaging filter combinations are summarized in Table 1 for a time
near the beginning of STIS operations. In this table PHOTPLAM is the pivot wavelength
1
also Space Telescope Science Institute, and Catholic University of America
234
c Copyright 2005 Space Telescope Science Institute. All rights reserved.
Calibration and Interpretation of STIS Imaging Mode Fluxes
235
in Å, PHOTFLAM is the flux (ergs/cm2 /s/Å) of a flat spectrum that produces 1 cnt/sec
in each mode, and PHOTBW the passband RMS width in Å. The corresponding keywords
in individual STIS image headers take into account the time dependent sensitivity changes,
and contain values appropriate for the actual date of each observation. See the ”SYNPHOT
User’s Guide” (Laidler et al. 2005) for detailed definitions of these parameters.
Table 1: STIS Imaging Mode Zero Points on April 14, 1997
Detector
CCD
NUV-MAMA
FUV-MAMA
∗ Calculated
2.
Aperture
50ccd
f28x50lp
f28x50oii
f28x50oiii∗
f25nd3
f25nd5
f25srf2
f25qtz
f25cniii
f25cn182
f25mgii
f25cn270
f25nd3
f25nd5
25mama
f25srf2
f25qtz
f25lya
f25nd3
f25nd5
PHOTPLAM
5733.23
7216.75
3738.06
5005.8
6314.84
7010.84
2304.01
2357.89
2263.35
2006.92
2873.82
2722.84
2358.49
2630.39
1374.38
1457.38
1595.04
1243.08
1376.05
1385.09
PHOTFLAM
9.951e-20
1.639e-19
4.690e-17
1.337e-16
4.508e-17
7.400e-15
5.567e-18
5.922e-18
4.986e-18
5.932e-17
2.015e-16
3.923e-17
4.461e-15
3.359e-12
2.103e-17
3.800e-17
1.036e-16
1.048e-15
2.146e-14
3.011e-11
PHOTBW
1840.03
1139.84
24.14
2.65
1987.74
2000.83
478.36
420.17
508.34
285.65
248.98
121.84
553.16
623.34
137.60
120.47
96.74
61.74
134.27
141.66
STmag
26.405
25.863
19.722
18.585
19.765
14.227
22.036
21.969
22.156
19.467
18.139
19.916
14.776
7.585
20.593
19.951
18.861
16.350
13.071
5.203
ABmag
26.305
25.264
20.551
18.780
19.455
13.690
23.916
23.798
24.074
21.646
19.539
21.433
16.605
9.177
23.595
22.825
21.540
19.569
16.070
8.188
VEGAmag
26.061
24.990
19.724
18.864
19.197
13.401
22.238
22.161
22.357
19.868
18.151
19.951
14.931
7.660
20.732
20.447
19.516
14.915
13.229
5.383
parameters for the OIII filter exclude the red leak
Determination of Absolute Throughputs
Since STIS is a spectrograph as well as an imaging instrument, the relative throughputs of
different filters as a function of wavelength were easily determined by comparing filtered and
unfiltered spectra of the same stars. To determine the wavelength dependent throughput
and aperture corrections for each detector’s unfiltered mode, deep images of a small number
of stars with well measured spectral energy distributions (SEDs) and spanning a wide range
of colors were observed with several filters. The detector throughputs vs. wavelength were
then adjusted to match the observed count rates for each filter and target.
For CCD imaging modes, the details of this calibration, including wavelength dependent
aperture corrections, were presented in Proffitt (2004). The overall CCD throughput at long
wavelengths had to be increased by up to 18% above prelaunch estimates. In addition, the
scattering of light into an extended red halo put up to 20% of the flux at distances from
the image center of more than 0.5”.
For the broadband MAMA filters, existing standard stars were too bright, and to
provide well calibrated standards long-slit STIS G140L, G230L, and G430L spectra were
taken of a number of hot HB stars in the globular cluster NGC 6681. This cluster was also
used as the primary calibration object for the long term monitoring of the MAMA imaging
stability, and so copious sets of images of these same stars are available in most MAMA
imaging modes. Details of the MAMA imaging absolute flux calibration are given in Proffitt
et al. (2003).
236
3.
Proffitt
Transforming STIS Magnitudes to other Photometric Systems
Given the large differences between STIS bandpasses and commonly used ground-based
photometric systems, the relationships between the different systems will be very sensitive
to the details of the spectral energy distributions (SED) being considered. The most rigorous
way to intercompare between such different bandpasses would be to use a series of spectral
energy distributions appropriate for the objects being studied to perform detailed synthetic
spectrum calculations for the all photometric bandpasses being used. However, such detailed
calculations can be time consuming to set up, and when performing quick evaluations of
STIS imaging data it would still be very useful to have some simple transformations between
STIS imaging magnitudes and those of more common systems, as long as the limitations of
such transformations are understood.
3.1.
Relationship of STIS CCD Imaging Bandpasses to other Photometric Systems
Comparing the STIS CCD throughput curves to standard broadband Johnson filters shows
that the STIS passbands (Figure 2) extend to significantly longer and shorter wavelengths
than does the UBVRc Ic system, and any transformation between STIS and other broadband
photometric systems will depend strongly on the details of the SED. This is illustrated in
Figure 3, where we plot synthetic colors and magnitudes calculated for several sequences
of Kurucz main-sequence models with different metallicities and assumed reddenings. Each
sequence ranges in Teff from 50000 to 3500 K.
Figure 2: The relative throughput of the STIS CCD imaging modes (solid lines) is compared
to that of Johnson bands (dashed lines) in the left hand figure, and in the right hand figure
to the throughput of SDSS (dashed lines) and GALEX (dotted lines) bandpasses.
Color-color relations (Figure 4) are somewhat tighter, especially when comparing STIS
CCD colors to B − Ic , but differential reddening still has a strong effect on the transformation.
The combined long wavelength filters of Gunn type photometric systems, such as that
used for the Sloane Digital Sky Survey (York et al., 2000), provide a better match to the
F28X50LP filter throughput (right hand panel of Figure 2). While no ground based system
can reach wavelengths as short as the unfiltered STIS CCD’s cutoff, these missing UV
wavelengths are filled in by the GALEX NUV band. This makes it possible to use SDSS
plus GALEX photometry to robustly predict STIS CCD magnitudes. This may be useful
to place STIS observations in the context of these surveys or to easily use synthetic colors
calculated for these systems when interpreting STIS imaging observations.
Calibration and Interpretation of STIS Imaging Mode Fluxes
237
Figure 3: Relation between STIS 50CCD (left) and F28X50LP (right) magnitudes and
Johnson V band as a function of color for six series of Kurucz main-sequence models.
Figure 4: Relations between STIS CCD clear minus longpass color and Johnson B − V and
B − Ic colors.
If, for the same series of Kurucz models used for Figure 3, we fit the STIS magnitudes
as a sum of the measured SDSS AB fluxes,
X
MAB (ST IS) = −2.5 log cf 10−MAB (f )/2.5 ,
f
we find the best fitting coefficients cf to be as given in Table 2.
Table 2: Coefficients cf used to estimate STIS 50CCD and F28X50LP AB magnitudes from
SDSS and GALEX magnitudes.
Target STIS
Filter
F28X50LP
50CCD
50CCD
GALEX NUV
...
...
0.070
Coefficients of Fit
u’
g’
r’
...
...
0.527
0.304 0.307 0.131
0.147 0.348 0.209
i’
0.250
0.218
0.140
z’
0.224
0.071
0.091
RMS residuals
0.0025
0.019
0.002
238
3.2.
Proffitt
Comparison of MAMA and GALEX Passbands
STIS has a variety of broadband UV imaging filters for use with the MAMAs. No particular
combination of the available choices was adopted as a standard color, although the FUV
MAMA with the SRF2 filter and the NUV MAMA with the QTZ filter were the most
commonly used modes. However, the GALEX mission (Martin et al. 2005) will survey the
entire sky in NUV and FUV passbands, and this suggests that the GALEX passbands may
become such a ”standard” vacuum UV color. It is therefore useful to consider how the STIS
MAMA imaging modes are related to the GALEX imaging bandpasses. In Figure 5, we
compare STIS MAMA and GALEX imaging passbands, and in Figures 5 through 7 we also
compare the relation between STIS and GALEX magnitudes as a function of color. Note,
however, that the GALEX bandpasses given by Martin et al. 2005 are preliminary, with a
quoted accuracy of about 10%.
Figure 5: STIS MAMA FUV (solid lines) and NUV (dashed lines) passbands are compared
with GALEX passbands (dotted lines) in the left hand panel. On the right, STIS FUV
clear aperture and GALEX FUV magnitudes for six series of Kurucz models are compared
as a function of a STIS FUV − NUV color.
Figure 6: STIS FUV SRF2 (left) and QTZ (right) magnitudes are compared with GALEX
FUV magnitudes. Note that the STIS SRF2 filter has a shorter and the STIS QTZ a
longer blue cuttoff than does the GALEX FUV bandpass, and this changes the slope of the
relationship between the STIS and GALEX magnitudes.
A large fraction of the unfiltered STIS FUV MAMA (25MAMA aperture) throughput
is at wavelengths shorter than the blue cutoff of the GALEX FUV filter, and this makes
it especially sensitive to differences in the SED. The STIS FUV with the SRF2 and QTZ
filters (Figure 6) are better matches. For unreddened stars, relatively tight transformations
Calibration and Interpretation of STIS Imaging Mode Fluxes
239
Figure 7: STIS NUV SRF2 (left) and QTZ (right) magnitudes are compared with GALEX
NUV magnitudes.
between these systems might be defined, but when extinction becomes substantial, the
differences in wavelength cutoffs for these filters have substantial effects.
At both short and long wavelength the throughput of the STIS NUV MAMA QTZ and
SRF2 modes extend significantly farther than does the GALEX NUV imaging bandpass.
This makes the relationship between STIS and GALEX NUV modes (Figure 7) an especially
strong function of the extinction.
4.
Summary
In this paper we have only been able to give a brief overview of the STIS imaging mode
throughputs and the relationship of these modes to other photometric systems. While many
of the details of the calibration are discussed in more detail in Proffitt (2004) and Proffitt
et al. (2003), we are also in the process of preparing more detailed quantitative information
that will allow STIS imaging mode count rates to be used to approximate measurements
in other common photometric bands. Included in this will be formulas that allow timedependent sensitivity changes, wavelength-dependent aperture corrections, and interstellar
extinction corrections to be taken into account.
References
Laidler et al., 2005, Synphot Data Users Guide (Baltimore: STScI)
Martin, D. C., et al. 2005, ApJ, 619, 1
Proffitt, C. R. 2004, Instrument Science Report STIS 2004-05 (Baltimore: STScI), available
through http://www.stsci.edu/hst/stis
Proffitt, C. R., Brown, T. M., Mobasher, B., & Davies, J. 2003, Instrument Science Report
STIS 2003-01 (Baltimore: STScI)
Stys, D. J., Bohlin, R. C., & Goudfrooij, P. 2004, Instrument Science Report STIS 2004-04
(Baltimore, STScI)
York, D. G., et al. 2000, AJ, 120, 1579


