Automated Injection ratio calculations
advertisement
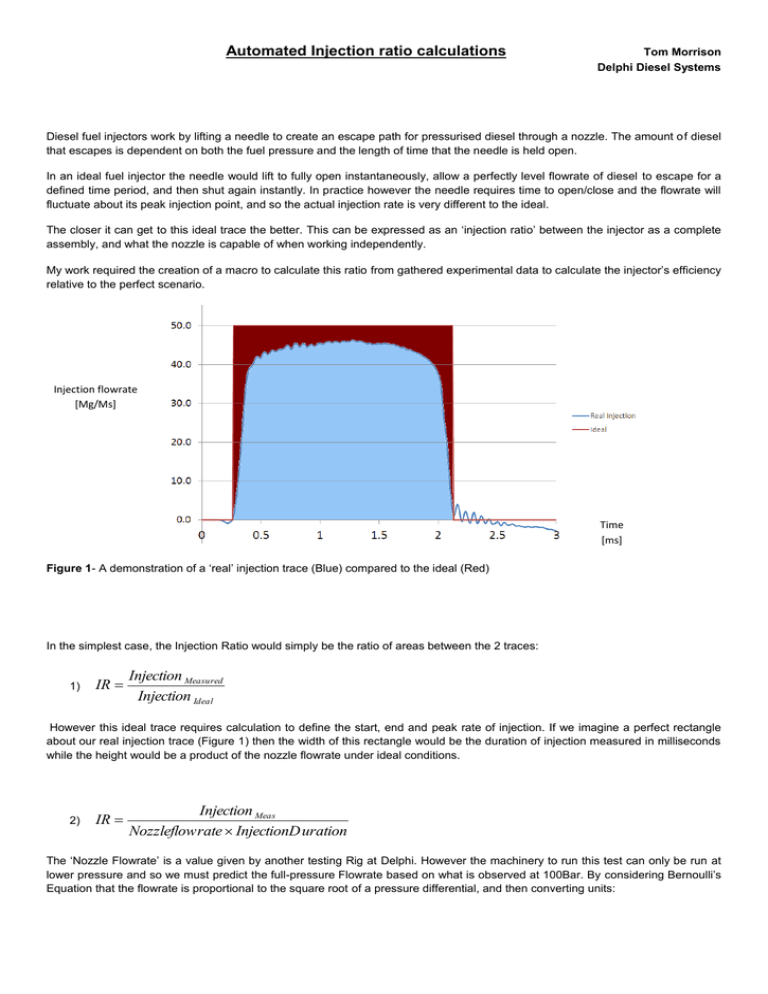
Automated Injection ratio calculations Tom Morrison Delphi Diesel Systems Diesel fuel injectors work by lifting a needle to create an escape path for pressurised diesel through a nozzle. The amount of diesel that escapes is dependent on both the fuel pressure and the length of time that the needle is held open. In an ideal fuel injector the needle would lift to fully open instantaneously, allow a perfectly level flowrate of diesel to escape for a defined time period, and then shut again instantly. In practice however the needle requires time to open/close and the flowrate will fluctuate about its peak injection point, and so the actual injection rate is very different to the ideal. The closer it can get to this ideal trace the better. This can be expressed as an ‘injection ratio’ between the injector as a complete assembly, and what the nozzle is capable of when working independently. My work required the creation of a macro to calculate this ratio from gathered experimental data to calculate the injector’s efficiency relative to the perfect scenario. Injection flowrate [Mg/Ms] Time [ms] Figure 1- A demonstration of a ‘real’ injection trace (Blue) compared to the ideal (Red) In the simplest case, the Injection Ratio would simply be the ratio of areas between the 2 traces: 1) IR Injection Measured Injection Ideal However this ideal trace requires calculation to define the start, end and peak rate of injection. If we imagine a perfect rectangle about our real injection trace (Figure 1) then the width of this rectangle would be the duration of injection measured in milliseconds while the height would be a product of the nozzle flowrate under ideal conditions. 2) IR Injection Meas Nozzleflow rate InjectionD uration The ‘Nozzle Flowrate’ is a value given by another testing Rig at Delphi. However the machinery to run this test can only be run at lower pressure and so we must predict the full-pressure Flowrate based on what is observed at 100Bar. By considering Bernoulli’s Equation that the flowrate is proportional to the square root of a pressure differential, and then converting units: 3) IR 36 Injection Meas Nozzleflow100Bar Pr essure InjectionD uration where nozzle flow is measured in kilograms/hour of fuel, ΔPressure is the change in pressure in Bar from inside to outside of the nozzle, Injection Duration is in milliseconds and InjectionMeas is in milligrams. Most of this information is already available from test results but the injection duration must be calculated for each rate trace, based on the corresponding ‘real’ trace seen in a test. The first stage is to evaluate the ‘Max Rate Value’ seen during the test. This was achieved by averaging the top 5% of the injection trace to account for fluctuation about the peak, as demonstrated in Figure 2 below. All figures within the green ellipse have been averaged to produce the straight line as a constant height. The needle open and needle close points were calculated by reading points at various percentages of the Max Rate Value and then using linear regression to find when the injection rate would be equal to zero. This was taken from 10% to 60% of the opening, and from 85% to 40% of the close. These points were chosen to avoid miscalculation from the ‘slump’ at the top of the opening, or the ‘bounce’ at the foot of the close. The difference in time between the open and close points is then defined as the ‘Injection Duration’. Based on these calculations, we can create the red ‘Perfect Trace’ as displayed above in Figure 1. Needle open Needle close Figure 2- Diagram showing the calculations performed on a rate trace as created by a hydraulic testing Rig. This then gives an Injection Ratio, typically in the region of 80-99% dependant on the fuel pressure used. My macro calculates and tabulates this ratio several hundred times for each data file, to present an Injection Ratio at every combination of activation pulse and pressure. Delphi specifies that the ‘true’ Injection Ratio should be taken at an Injection Duration of 1.5ms, and again my macro will look through its processed results to provide this value at each pressure.

