A T M
advertisement
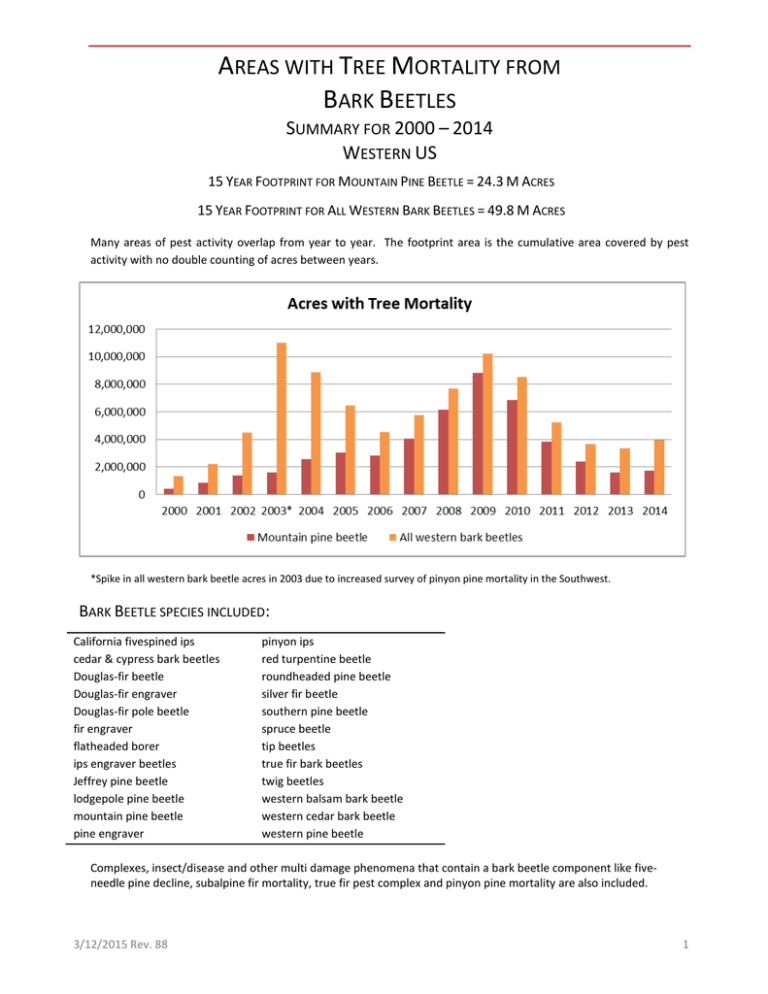
AREAS WITH TREE MORTALITY FROM BARK BEETLES SUMMARY FOR 2000 – 2014 WESTERN US 15 YEAR FOOTPRINT FOR MOUNTAIN PINE BEETLE = 24.3 M ACRES 15 YEAR FOOTPRINT FOR ALL WESTERN BARK BEETLES = 49.8 M ACRES Many areas of pest activity overlap from year to year. The footprint area is the cumulative area covered by pest activity with no double counting of acres between years. *Spike in all western bark beetle acres in 2003 due to increased survey of pinyon pine mortality in the Southwest. BARK BEETLE SPECIES INCLUDED: California fivespined ips cedar & cypress bark beetles Douglas-fir beetle Douglas-fir engraver Douglas-fir pole beetle fir engraver flatheaded borer ips engraver beetles Jeffrey pine beetle lodgepole pine beetle mountain pine beetle pine engraver pinyon ips red turpentine beetle roundheaded pine beetle silver fir beetle southern pine beetle spruce beetle tip beetles true fir bark beetles twig beetles western balsam bark beetle western cedar bark beetle western pine beetle Complexes, insect/disease and other multi damage phenomena that contain a bark beetle component like fiveneedle pine decline, subalpine fir mortality, true fir pest complex and pinyon pine mortality are also included. 3/12/2015 Rev. 88 1 ACRES SUMMARY BY YEAR 2000 – 2014 MOUNTAIN PINE BEETLE 2000 Arizona 2001 2002 2003 2004 2005 49.2 169.0 122.2 5.0 0.2 2006 2007 2008 112.0 2.5 57,535.7 2009 2010 2011 2012 2013 2014 3.5 2.0 10,243.1 3,948.2 224,296.6 California 5,671.7 71,317.5 16,082.5 25,726.3 51,022.6 40,647.9 60,586.1 52,407.0 91,335.4 90,259.3 89,899.4 187,318.1 136,421.3 Colorado 139,293.7 151,202.4 209,484.3 235,905.7 436,725.2 500,246.6 667,981.6 987,153.6 1,155,727.4 1,047,275.4 879,091.3 754,447.3 264,716.5 96,631.5 15,363.4 Idaho 117,949.0 170,167.6 335,976.9 343,354.7 549,236.9 511,788.8 298,396.0 391,023.3 1,007,981.9 1,923,187.9 1,940,900.7 783,190.1 708,536.9 298,327.1 296,498.8 41,085.1 112,256.3 246,936.8 285,735.7 449,761.3 748,690.3 794,615.5 733,011.2 1,766,694.8 3,492,874.4 2,058,199.1 971,315.1 631,702.0 522,747.8 590,563.6 4.8 301.6 8.6 143.1 19,650.1 16,569.3 3,599.9 1,110.0 Montana Nebraska Nevada New Mexico 0.9 1,003.0 1,642.1 3,071.0 815.8 2,287.7 3,768.4 2,335.3 3,889.0 2,717.7 3,877.2 8,728.6 25,620.7 40,183.0 5.4 3,527.4 9.6 Oregon 42,904.5 68,908.4 167,794.7 173,154.5 218,929.1 256,014.9 350,853.4 500,389.9 497,971.9 394,132.0 418,006.6 236,819.5 224,869.3 300,166.4 339,034.2 South Dakota 13,498.5 102,608.7 102,767.2 189,684.4 57,552.3 19,256.0 39,947.5 25,682.1 25,115.5 22,370.8 44,161.9 66,197.2 29,878.8 32,630.1 15,126.3 2,154.2 17,653.0 26,861.4 53,645.8 144,475.3 111,973.8 83,193.1 273,529.6 274,872.9 227,081.3 225,137.8 67,623.2 27,663.3 31,667.2 12,745.1 62,242.4 118,714.8 150,203.9 204,755.1 277,224.3 471,923.0 189,872.6 220,675.0 262,636.0 404,535.0 237,584.8 108,476.3 154,324.8 103,605.1 135,266.0 55,124.9 101,635.0 90,276.5 383,870.2 385,028.1 320,531.8 862,284.1 1,106,628.8 1,200,981.8 933,040.3 717,689.2 161,923.7 81,624.9 112,268.5 Utah Washington Wyoming Grand Total 9,380.9 435,998.8 871,932.6 1,364,751.1 1,604,696.2 2,572,691.2 3,048,292.7 2,809,854.8 4,060,126.0 6,175,659.4 8,843,957.0 6,846,036.6 3,812,531.6 2,394,543.9 1,615,327.1 1,748,637.9 ALL WESTERN BARK BEETLES Arizona 2000 2001 2002 2003 2004 2005 2006 2007 2008 2009 2010 2011 2012 2013 2014 16,143.0 88,031.1 517,234.7 1,694,722.0 138,496.7 38,787.4 30,416.2 21,571.6 10,306.8 1,890.6 21,051.5 5,494.6 34,498.9 166,983.7 137,287.5 851,783.9 309,378.4 197,496.1 170,750.3 365,271.6 684,773.8 508,582.6 398,969.1 378,342.5 799,255.6 1,367,387.5 1,370,100.3 1,212,156.5 817,934.7 761,971.5 741,471.1 California 55,107.2 78,277.8 911,992.7 2,945,935.5 1,707,845.3 Colorado 363,637.5 427,404.6 669,191.2 1,835,939.4 1,448,247.9 1,190,515.4 1,148,290.9 1,471,292.3 1,575,234.2 Idaho 313,366.7 395,505.7 587,712.4 650,059.5 1,087,628.8 Montana 104,156.4 224,296.3 395,444.5 439,910.8 10,289.9 12,045.3 1,515.4 3,232.8 777.1 7,212.9 161.8 91.7 378.6 8.6 320.0 8,331.4 2,402.9 9,761.1 73,845.7 440,635.6 805,943.0 53,671.6 24,488.6 14,444.6 31,957.5 128,641.8 28,537.7 21,056.3 7,701.9 3,788.4 29,375.8 46,681.5 71,888.4 177,117.3 910,185.7 293,208.3 168,159.8 180,012.8 123,763.9 99,741.5 36,563.4 20,931.9 166,677.2 172,135.7 339,856.0 199,983.6 107,629.1 117,966.3 338,710.2 550,534.6 670,403.2 467,382.6 453,221.5 592,893.9 613,701.9 447,566.3 536,897.2 301,362.9 258,832.4 344,253.1 410,232.6 Nebraska Nevada New Mexico 682,815.0 366,049.7 438,759.4 1,291,542.9 2,083,747.0 2,049,320.9 887,508.7 772,679.4 355,941.3 378,435.7 668,740.7 1,080,990.8 922,674.6 836,801.3 1,831,659.9 3,565,610.7 2,092,383.7 992,224.5 637,520.8 546,032.8 618,772.4 Nort Dakota Oregon 36.0 South Dakota 13,543.2 139,943.0 117,470.7 238,034.9 101,321.6 23,763.5 41,158.3 27,346.8 26,398.6 23,202.7 44,620.9 66,224.1 29,878.8 32,739.4 15,221.7 Utah 57,894.1 140,077.6 105,374.4 363,709.4 565,072.2 325,286.2 122,677.9 434,593.0 358,332.0 271,024.8 279,104.5 98,116.5 56,938.3 100,309.3 147,404.3 540,596.7 493,222.3 664,727.2 361,757.2 180,654.2 263,369.3 160,117.3 217,213.1 1,257,828.9 1,015,172.5 800,369.2 205,428.2 144,524.6 246,660.7 Washington Wyoming Grand Total 150,252.2 288,871.5 330,049.2 631,268.4 720,264.7 849,950.3 418,910.7 89,064.3 210,482.4 272,404.5 290,504.7 668,458.5 745,013.6 494,198.3 1,070,478.5 1,189,514.6 1,319,878.1 2,192,505.8 4,496,547.5 11,001,730.4 8,887,676.2 6,479,635.5 4,514,710.7 5,770,815.2 7,699,575.4 10,213,624.3 8,504,743.8 5,240,805.7 3,655,895.8 3,335,180.0 3,949,681.4 Note: Numbers are for each year’s “current” damage and are not cumulative from year to year. Numbers should not be added across years because there may be significant overlap from year to year. Numbers are from the National Insect & Disease Survey database. 3/12/2015 Rev. 88 2 AREA WITH TREE MORTALITY FROM ALL WESTERN BARK BEETLES 2000 – 2014 PERCENT OF TREED AREA WITH DAMAGE BY SUBWATERSHEDS (6TH LEVEL HUCS) 3/12/2015 Rev. 88 3 AREA WITH TREE MORTALITY FROM MOUNTAIN PINE BEETLE 2000 – 2014 PERCENT OF TREED AREA WITH DAMAGE BY SUBWATERSHEDS (6TH LEVEL HUCS) 3/12/2015 Rev. 88 4
