advertisement
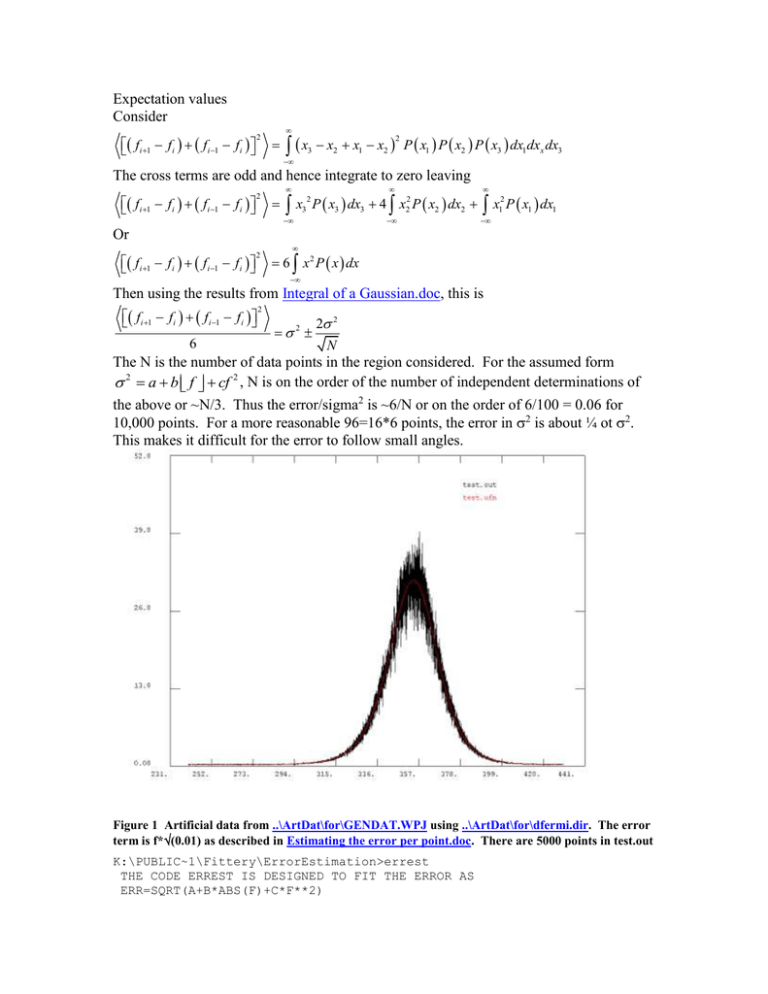
Expectation values Consider fi 1 fi fi 1 fi 2 x 3 x2 x1 x2 P x1 P x2 P x3 dx1dxx dx3 2 The cross terms are odd and hence integrate to zero leaving fi 1 fi fi 1 fi 2 x32 P x3 dx3 4 x22 P x2 dx2 x P x dx 2 1 1 1 Or fi 1 fi fi 1 fi 2 6 x 2 P x dx Then using the results from Integral of a Gaussian.doc, this is fi 1 fi fi 1 fi 6 2 2 2 2 N The N is the number of data points in the region considered. For the assumed form 2 a b f cf 2 , N is on the order of the number of independent determinations of the above or ~N/3. Thus the error/sigma2 is ~6/N or on the order of 6/100 = 0.06 for 10,000 points. For a more reasonable 96=16*6 points, the error in 2 is about ¼ ot 2. This makes it difficult for the error to follow small angles. Figure 1 Artificial data from ..\ArtDat\for\GENDAT.WPJ using ..\ArtDat\for\dfermi.dir. The error term is f*(0.01) as described in Estimating the error per point.doc. There are 5000 points in test.out K:\PUBLIC~1\Fittery\ErrorEstimation>errest THE CODE ERREST IS DESIGNED TO FIT THE ERROR AS ERR=SQRT(A+B*ABS(F)+C*F**2) OPTIONS ARE 1 FIT A ONLY, B AND C ARE ZERO 2 FIT A AND B ONLY C = 0 3 FIT A, B AND C 4 FIT B ONLY 5 FIT C ONLY ENTER THE DESIRED OPTION 5 ENTER THE NAME OF THE DATA FILE test.out A = 0.0000000000000000 B = 0.0000000000000000 C = 0.0116123901542815 – Err/sigma = .16, while 6/5000 = 0.085 c is a bit high. ERR= 0.0000000000000000 OUTPUT WILL BE IN test.c K:\PUBLIC~1\Fittery\ErrorEstimation>errest THE CODE ERREST IS DESIGNED TO FIT THE ERROR AS ERR=SQRT(A+B*ABS(F)+C*F**2) OPTIONS ARE 1 FIT A ONLY, B AND C ARE ZERO 2 FIT A AND B ONLY C = 0 3 FIT A, B AND C 4 FIT B ONLY 5 FIT C ONLY ENTER THE DESIRED OPTION 3 ENTER THE NAME OF THE DATA FILE test.out A = -0.0575477145140940 B = 0.1507880821819592 C = 0.0052752652935748 ERR= 2.7755575615628910D-017 OUTPUT WILL BE IN test.abc Figure 2 The dots are the error estimates for each point. The two solid plots are a fit using c alone, and one using a,b, anc c in the form 2 = a + b f + c f2. The 3 constants do not follow the data as well as the fit using c alone.
