advertisement
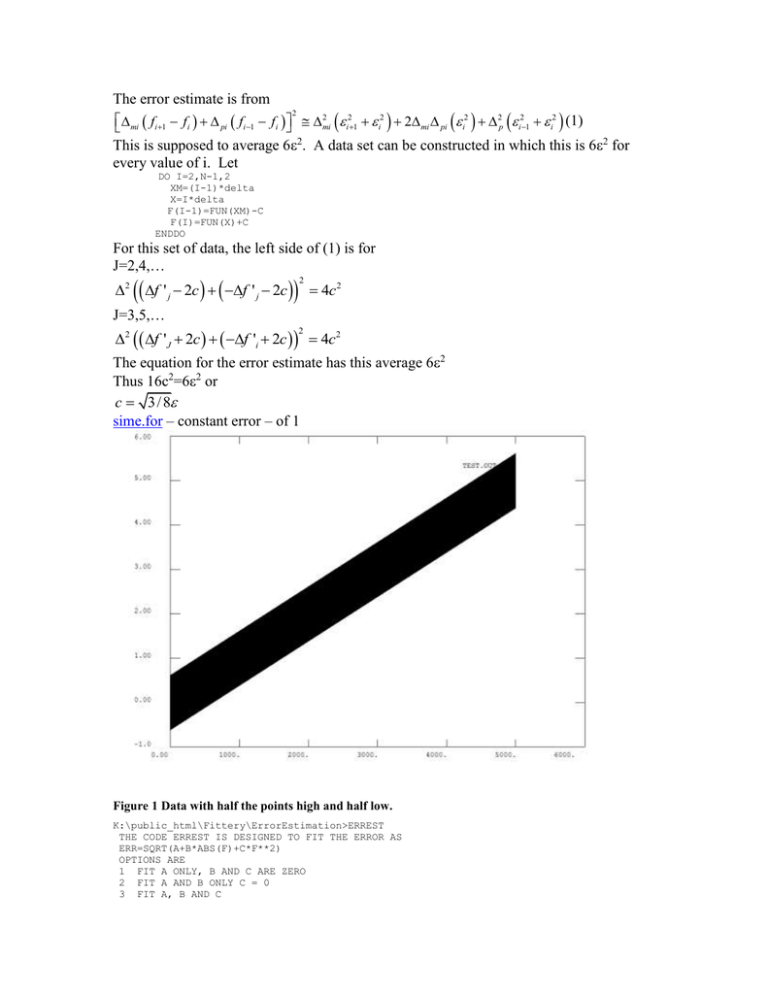
The error estimate is from 2 mi fi 1 fi pi fi 1 fi mi i21 i2 2mi pi i2 2p i21 i2 (1) 2 This is supposed to average 62. A data set can be constructed in which this is 62 for every value of i. Let DO I=2,N-1,2 XM=(I-1)*delta X=I*delta F(I-1)=FUN(XM)-C F(I)=FUN(X)+C ENDDO For this set of data, the left side of (1) is for J=2,4,… 2 f ' j 2c f ' j 2c 2 4c 2 J=3,5,… 2 f 'J 2c f 'i 2c 4c 2 2 The equation for the error estimate has this average 62 Thus 16c2=62 or c 3/ 8 sime.for – constant error – of 1 Figure 1 Data with half the points high and half low. K:\public_html\Fittery\ErrorEstimation>ERREST THE CODE ERREST IS DESIGNED TO FIT THE ERROR AS ERR=SQRT(A+B*ABS(F)+C*F**2) OPTIONS ARE 1 FIT A ONLY, B AND C ARE ZERO 2 FIT A AND B ONLY C = 0 3 FIT A, B AND C 4 FIT B ONLY 5 FIT C ONLY ENTER THE DESIRED OPTION 3 ENTER THE NAME OF THE DATA FILE TEST.OUT A = 1.0000004064787330 limited only by machine precision B = -9.1506823071757370D-007 C = 1.5539231141905710D-007 ERR= -1.6172424510685350D-011 OUTPUT WILL BE IN TEST.EST Gauss random Figure 2 Data with a Gaussian distribution of average 1 The value of any point in figure 2 is using (1) is mi fi 1 fi pi f i 1 f i mi i 1 i pi i 1 i 2 2 2 2 mi 2 i 1 i 2 mi pi i 1 i i 1 i pi 2 i 1 i (2) After discarding the cross terms which ensemble average to 0 2 mi fi 1 fi pi fi 1 fi mi 2 i 12 mi 2 i 2 2 mi pi i 2 pi 2 i 12 pi 2 i 2 (3) Over an ensemble average with a Gaussian distribution with width , Integral of a Gaussian.doc, the odd terms integrate to zero and 2 2 so that mi fi 1 fi pi f i 1 f i (4) 2 mi 2 i 2 mi 2 i 12 2 mi pi i 2 pi 2 i 12 pi 2 i 2 This for all delta’s equal 1 says that the average of the oscillating term squared is 62. The average of the square of the term sumed in 2 is needed for the error estimate 2 2 mi fi 1 fi pi fi 1 f i mi 2 i 1 i 2 mi pi i 1 i i 1 i pi 2 i 1 i 4 mi 4 i 1 i 4 mi 2 pi 2 i 1 i 2 i 1 i 2 pi 4 i 1 i 4 4 mi 2 mi pi i 1 i 2 i 1 i 1 i 1 i i i 1 i 2 2 2 2 2 2 mi i 1 i pi i 1 i 4 2 2 pi mi pi i 1 i i 1 i i 1 i 4 Holding only the even terms mi fi 1 fi pi fi 1 fi oddterms mi 4 i 14 6 i 12 i 2 i 4 4 mi 2 pi 2 i 12 i 12 i 12 i 2 i 4 pi 4 i 14 6 i 12 i 2 i 4 4 mi 2 mi pi i 12 i 2 2 i 12 i 2 i 4 2 mi 2 pi 2 i 12 i 12 i 2 i 12 i 2 i 12 i 4 4 pi 2 mi pi i 12 i 2 2 i 12 i 2 i 4 4 The squared terms average over a Gaussian distribution to 2 while the fourth powers average to 24 Integral of a Gaussian.doc so that the ensemble average is mi fi 1 fi pi fi 1 f i 4 mi 4 2 6 2 4 mi 2 pi 2 1 1 2 i 4 pi 4 2 6 2 4 mi 3 pi 1 2 2 2 2 3 2 mi pi 1 1 1 2 4 pi mi 1 2 2 (5) The distinction between i-1, i, and i+1 has been ignored in (5) The error term is thus 2 mi fi 1 fi pi f i 1 f i 4 mi f i 1 f i pi f i 1 f i 2 2 mi 4 2 6 2 4 mi 2 pi 2 1 1 2 2 2 2 i 4 pi 4 2 6 2 4 mi 3 pi 1 2 2 4 mi mi pi pi 2 mi 2 pi 2 1 1 1 2 4 pi 3 mi 1 2 2 4 4 2 2 10 mi pi 30 mi pi 4 mi 4 2 mi 3 pi mi pi 3 3 mi 2 pi 2 pi 4 i4 20 3 3 mi pi pi mi i 4 6 mi 4 pi 4 18 mi 2 pi 2 12 mi 3 pi pi 3 mi 2 (6) With all delta’s equal to 1 this is 544. This says that 2 is calculated with an error of (54/6) for each point. Or equivalently, each point predicts 2 3 2 K:\PUBLIC~1\Fittery\ERRORE~1>errest THE CODE ERREST IS DESIGNED TO FIT THE ERROR AS ERR=SQRT(A+B*ABS(F)+C*F**2) OPTIONS ARE 1 FIT A ONLY, B AND C ARE ZERO 2 FIT A AND B ONLY C = 0 3 FIT A, B AND C 4 FIT B ONLY 5 FIT C ONLY ENTER THE DESIRED OPTION 3 ENTER THE NAME OF THE DATA FILE test.out A = 1.7670219674060160 B = -0.6021908354246110 C = 0.0842177393747761 ERR= -5.8207660913467410D-011 OUTPUT WILL BE IN test.EST Figure 3 Black line connects individual estimates of 2. Blue line connects estimates based on 2 a bf cf 2 . The function f is f(x)+I and is shown in the figure above. The curve should be at 13/(5000/3), where the last 3 reflects the fact that the error estimates are not statistically independent. K:\public_html\Fittery\ErrorEstimation>errest THE CODE ERREST IS DESIGNED TO FIT THE ERROR AS ERR=SQRT(A+B*ABS(F)+C*F**2) OPTIONS ARE 1 FIT A ONLY, B AND C ARE ZERO 2 FIT A AND B ONLY C = 0 3 FIT A, B AND C 4 FIT B ONLY 5 FIT C ONLY ENTER THE DESIRED OPTION 1 ENTER THE NAME OF THE DATA FILE test.out A = 0.9421409819383385 err = 0.058 compare 3/40 = 0.075 B = 0.0000000000000000 C = 0.0000000000000000 ERR= 0.0000000000000000 OUTPUT WILL BE IN test.EST A simulation with a value of c =10-4 is in SIMEGRC.FOR K:\PUBLIC~1\Fittery\ERRORE~1>errest THE CODE ERREST IS DESIGNED TO FIT THE ERROR AS ERR=SQRT(A+B*ABS(F)+C*F**2) OPTIONS ARE 1 FIT A ONLY, B AND C ARE ZERO 2 FIT A AND B ONLY C = 0 3 FIT A, B AND C 4 FIT B ONLY 5 FIT C ONLY ENTER THE DESIRED OPTION 5 ENTER THE NAME OF THE DATA FILE test.out A = 0.0000000000000000 B = 0.0000000000000000 C = 1.0816415929070580D-004 ERR= 0.0000000000000000 This illustrates that there is a problem as the error approaches or exceeds the size of the function. At that point the value of the function is so poorly defined that it gets mixed into the fit to the error. K:\PUBLIC~1\Fittery\ERRORE~1>errest THE CODE ERREST IS DESIGNED TO FIT THE ERROR AS ERR=SQRT(A+B*ABS(F)+C*F**2) OPTIONS ARE 1 FIT A ONLY, B AND C ARE ZERO 2 FIT A AND B ONLY C = 0 3 FIT A, B AND C 4 FIT B ONLY 5 FIT C ONLY ENTER THE DESIRED OPTION 5 ENTER THE NAME OF THE DATA FILE test.out A = 0.0000000000000000 B = 0.0000000000000000 C = 0.0026304982451279 0.0016 ERR= 0.0000000000000000 OUTPUT WILL BE IN test.EST K:\PUBLIC~1\Fittery\ERRORE~1>errest THE CODE ERREST IS DESIGNED TO FIT THE ERROR AS ERR=SQRT(A+B*ABS(F)+C*F**2) OPTIONS ARE 1 FIT A ONLY, B AND C ARE ZERO 2 FIT A AND B ONLY C = 0 3 FIT A, B AND C 4 FIT B ONLY 5 FIT C ONLY ENTER THE DESIRED OPTION 3 ENTER THE NAME OF THE DATA FILE test.out A = -2.0382455788840400D-004 B = 0.0005828916847791 C = 0.0024628186100235 ERR= -4.5474735088646410D-013 OUTPUT WILL BE IN test.EST
