T
THREE YEAR CAPITAL PLAN (CAPITAL BUDGET 2010/2011
– 2012/13)
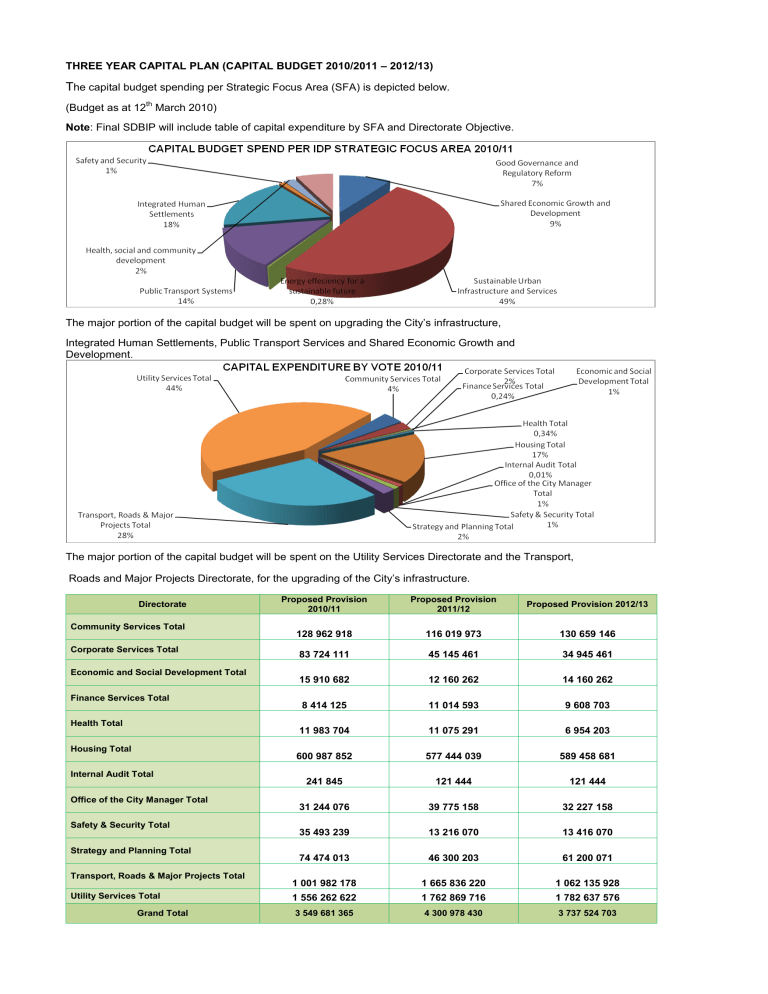
T he capital budget spending per Strategic Focus Area (SFA) is depicted below.
(Budget as at 12 th
March 2010)
Note : Final SDBIP will include table of capital expenditure by SFA and Directorate Objective.
The major portion of the capital budget will be spent on upgrading the City’s infrastructure,
Integrated Human Settlements, Public Transport Services and Shared Economic Growth and
Development .
The major portion of the capital budget will be spent on the Utility Services Directorate and the Transport,
Roads and Major Projects Directorate, for the upgrading of the City’s infrastructure.
Directorate
Proposed Provision
2010/11
Proposed Provision
2011/12
Proposed Provision 2012/13
Community Services Total
Corporate Services Total
128 962 918
83 724 111
116 019 973
45 145 461
130 659 146
34 945 461
Economic and Social Development Total
15 910 682 12 160 262 14 160 262
Finance Services Total
8 414 125 11 014 593 9 608 703
Health Total
11 983 704 11 075 291 6 954 203
Housing Total
600 987 852 577 444 039 589 458 681
Internal Audit Total
241 845 121 444 121 444
Office of the City Manager Total
31 244 076 39 775 158 32 227 158
Safety & Security Total
35 493 239 13 216 070 13 416 070
Strategy and Planning Total
74 474 013 46 300 203 61 200 071
Transport, Roads & Major Projects Total
Utility Services Total
Grand Total
1 001 982 178
1 556 262 622
3 549 681 365
1 665 836 220
1 762 869 716
4 300 978 430
1 062 135 928
1 782 637 576
3 737 524 703
REVENUE AND EXPENDITURE PROJECTIONS
This section contains the financial information as required of the SDBIP.
Monthly projections of Revenue by Source
Other Revenue includes:
Rental of facilities and equipment, Interest earned, Dividends received, Fines, Licences and permits, Agency services,
Transfers recognised – Operational and Gains on disposal of PPE.
CATEGORY DESCRIPTION
R thousand
Revenue By Source
Property rates
Property rates - penalties & collection charges
Service charges - electricity revenue
Service charges - water revenue
Service charges - sanitation revenue
Service charges - refuse revenue
Service charges - other
Rental of facilities and equipment
Interest earned - external investments
Interest earned - outstanding debtors
Fines
Licences and permits
Agency services
Other revenue
Transfers recognised - operational
Gains on disposal of PPE
Total Revenue (excluding capital transfers and contributions)
Total
4 085 376
70 430
6 636 214
1 659 871
899 609
762 770
651 133
244 503
213 936
210 860
177 011
28 764
115 993
1 760 203
1 416 754
310 444
19 243 871
Table: Expenditure by Vote (Directorate)
– Rand in Thousands

