Balance Sheet
advertisement
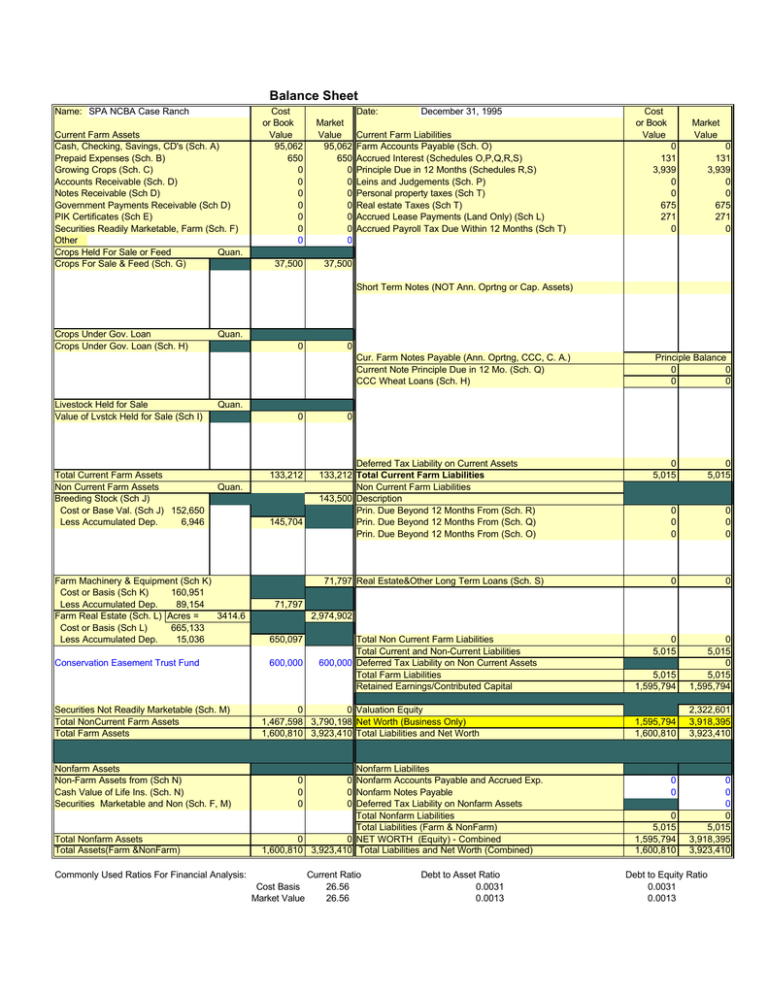
Balance Sheet Name: SPA NCBA Case Ranch Current Farm Assets Cash, Checking, Savings, CD's (Sch. A) Prepaid Expenses (Sch. B) Growing Crops (Sch. C) Accounts Receivable (Sch. D) Notes Receivable (Sch D) Government Payments Receivable (Sch D) PIK Certificates (Sch E) Securities Readily Marketable, Farm (Sch. F) Other Crops Held For Sale or Feed Quan. Crops For Sale & Feed (Sch. G) Cost or Book Value 95,062 650 0 0 0 0 0 0 0 Market Value 95,062 650 0 0 0 0 0 0 0 Date: 37,500 37,500 December 31, 1995 Current Farm Liabilities Farm Accounts Payable (Sch. O) Accrued Interest (Schedules O,P,Q,R,S) Principle Due in 12 Months (Schedules R,S) Leins and Judgements (Sch. P) Personal property taxes (Sch T) Real estate Taxes (Sch T) Accrued Lease Payments (Land Only) (Sch L) Accrued Payroll Tax Due Within 12 Months (Sch T) Cost or Book Value Market Value 0 131 3,939 0 0 675 271 0 0 131 3,939 0 0 675 271 0 Short Term Notes (NOT Ann. Oprtng or Cap. Assets) Crops Under Gov. Loan Crops Under Gov. Loan (Sch. H) Quan. 0 0 Cur. Farm Notes Payable (Ann. Oprtng, CCC, C. A.) Current Note Principle Due in 12 Mo. (Sch. Q) CCC Wheat Loans (Sch. H) Livestock Held for Sale Value of Lvstck Held for Sale (Sch I) Total Current Farm Assets Non Current Farm Assets Breeding Stock (Sch J) Cost or Base Val. (Sch J) 152,650 Less Accumulated Dep. 6,946 Principle Balance 0 0 0 0 Quan. 0 133,212 Quan. 145,704 Farm Machinery & Equipment (Sch K) Cost or Basis (Sch K) 160,951 Less Accumulated Dep. 89,154 Farm Real Estate (Sch. L) Acres = 3414.6 Cost or Basis (Sch L) 665,133 Less Accumulated Dep. 15,036 650,097 Conservation Easement Trust Fund 600,000 0 Deferred Tax Liability on Current Assets 133,212 Total Current Farm Liabilities Non Current Farm Liabilities 143,500 Description Prin. Due Beyond 12 Months From (Sch. R) Prin. Due Beyond 12 Months From (Sch. Q) Prin. Due Beyond 12 Months From (Sch. O) 71,797 Real Estate&Other Long Term Loans (Sch. S) 0 5,015 0 0 0 0 0 0 0 0 0 5,015 5,015 1,595,794 0 5,015 0 5,015 1,595,794 1,595,794 1,600,810 2,322,601 3,918,395 3,923,410 71,797 2,974,902 Total Non Current Farm Liabilities Total Current and Non-Current Liabilities 600,000 Deferred Tax Liability on Non Current Assets Total Farm Liabilities Retained Earnings/Contributed Capital Securities Not Readily Marketable (Sch. M) Total NonCurrent Farm Assets Total Farm Assets 0 0 Valuation Equity 1,467,598 3,790,198 Net Worth (Business Only) 1,600,810 3,923,410 Total Liabilities and Net Worth Nonfarm Assets Non-Farm Assets from (Sch N) Cash Value of Life Ins. (Sch. N) Securities Marketable and Non (Sch. F, M) Nonfarm Liabilites 0 Nonfarm Accounts Payable and Accrued Exp. 0 Nonfarm Notes Payable 0 Deferred Tax Liability on Nonfarm Assets Total Nonfarm Liabilities Total Liabilities (Farm & NonFarm) 0 0 NET WORTH (Equity) - Combined 1,600,810 3,923,410 Total Liabilities and Net Worth (Combined) Total Nonfarm Assets Total Assets(Farm &NonFarm) 0 5,015 0 0 0 Commonly Used Ratios For Financial Analysis: Cost Basis Market Value Current Ratio 26.56 26.56 Debt to Asset Ratio 0.0031 0.0013 0 0 0 5,015 1,595,794 1,600,810 0 0 0 0 5,015 3,918,395 3,923,410 Debt to Equity Ratio 0.0031 0.0013 Enter Name of Farm or Owner(s) Enter the Balance Sheet Date SPA NCBA Case Ranch December 31, 1995 This Shading Means Calculated Cell This Shading Means No Entry Here Current Schedule A -- Cash, Checking, Savings, CD's (Farm Only) Balance Cash and Checking 49665 Capital Fund $52,750 - 5800 for big boss and sprayer - 1645 for post pounder 45397 Cash on Hand 0 Savings Accounts and CD's 0 Money Market 0 Other 0 Total Cash, Checking, Savings, CD's Available 95062 Schedule B -- Prepaid Expenses and Supplies Description of Item Misc. Total Cost of Prepaid Expenses and Supplies Total Fair Market Value Prepaid Expenses and Supplies Quantity Fair Bu./Ton Cost Total Market Cwt/Gal Per Unit Cost Value/Unit 1 650.00 650.00 650.00 0 0.00 0.00 1.00 0 0.00 0.00 0.00 0 0.00 0.00 0.00 0 0.00 0.00 0.00 0 0.00 0.00 0.00 0 0.00 0.00 0.00 0 0.00 0.00 0.00 0 0.00 0.00 0.00 0 0.00 0.00 0.00 0 0.00 0.00 0.00 650 Market Value 650.00 0.00 0.00 0.00 0.00 0.00 0.00 0.00 0.00 0.00 0.00 650 Schedule C -- Invested in Growing Crops Crop Quant. Of Price Matral Material Per Unit 0.00 0.00 0.00 0.00 0.00 0.00 0.00 0.00 0.00 0.00 0.00 0.00 0.00 0.00 0.00 0.00 0.00 0.00 0.00 0.00 0.00 0.00 0.00 0.00 0.00 0.00 0.00 0.00 0.00 0.00 0.00 0.00 0.00 0.00 0.00 0.00 Total Invested in Growing Crops Number Total Acres Invested 0.00 0 0.00 0 0.00 0 0.00 0 0.00 0 0.00 0 0.00 0 0.00 0 0.00 0 0.00 0 0.00 0 0.00 0 0 Schedule D -- Receivables Accounts, Notes, Gov. Payments (Current) Accounts Receivable Date Receivable From Description Due Interest Amount Accrued Rate Receivable Interest Total Accounts Receivable Notes Receivable Receivable From 0 Date Due Description Interest Amount Accrued Rate Receivable Interest Total Notes Receivable Government Payments Receivable Receivable From 0 0 Total Payment Description Total Government Payments Total Government Payments Receivable Schedule E -- PIK Certificates Crop Description Cost of Certs Purchsed Face Value of Certs Received Market Value of Purchased and Received Certs Cost if Purch. 0 0 0 0 0 0 0 0 0 0 Face Value Recvd 0 0 0 0 0 0 0 0 0 0 Expir. Date 0 0 0 0 0 0 0 0 0 0 Expected Premium Above Cost/Face 0 0 0 0 0 0 0 0 0 0 Prin. & Int. Due 0 0 0 0 0 0 0 0 0 Prin. & Int. Due 0 0 0 0 0 0 0 0 0 Balance Due 0 0 Market Value 0 0 0 0 0 0 0 0 0 0 0 0 0 Schedule F -- Securities Readily Marketable Number of Shares 0 0 0 0 0 0 0 0 Description Cost Basis of Marketable Securties Market Value of Readily Marketable Securities Value of Farm Portion (Cost & Market) Value of Non-Farm Portion (Cost & Market) Original Market Total Cost Price Original Per Unit Per Unit Cost 0 0 0 0 0 0 0 0 0 0 0 0 0 0 0 0 0 0 0 0 0 0 0 0 0 0 0 Schedule G -- Crops Held For Sale or Feed (Raised & Purchased) - Free Stocks Raised Quan. Required For Sale or Feed Bu.-Tons For Available Description Cwt. Feed To Sell Hay Purchased For Sale or Feed Description 625 Total FMV Raised Crops and Feed Quan. Purchase Bu./Tons Price Per Cwt Unit 0 0 0 0 0 0 0 0 0 0 0 0 0 0 0 0 0 0 Cost Value of Purchased Crops Market Value of Purchased Crops 625 0 Fair Market Value 0 0 0 0 0 0 0 0 Percent To Non-Farm 100% 100% 100% 100% 100% 100% 100% 100% 0 0 0 Market Price Per Unit 60.00 Total Available Market Cost To Sell Price/Unit 0 0 0.00 0 0 0.00 0 0 0.00 0 0 0.00 0 0 0.00 0 0 0.00 0 0 0.00 0 0 0.00 0 0 0.00 0 Fair Market Value 0 0 37500 0 0 0 0 0 0 0 0 0 0 0 37500 Fair Market Value 0 0 0 0 0 0 0 0 0 0 Schedule H -- CCC and Other Government Stored Grain Grain Description Units Year Loan Sealed Market Sealed Rate T/C/BU Price 0 0 0 0.00 0 0 0 0.00 0 0 0 0.00 0 0 0 0.00 0 0 0 0.00 0 0 0 0.00 0 0 0 0.00 0 0 0 0.00 0 0 0 0.00 0 0 0 0.00 0 0 0 0.00 0 0 0 0.00 Total Dollars of Equity in Government Grain Total Loan Amount Against Crops Total Market Value of Grain Under Loan Schedule I -- Livestock Held for Sale Raised Livestock Description Purchased Livestock Description Total Dollars Equity 0.00 0.00 0.00 0.00 0.00 0.00 0.00 0.00 0.00 0.00 0.00 0.00 0 Total Loan Amount 0.00 0.00 0.00 0.00 0.00 0.00 0.00 0.00 0.00 0.00 0.00 0.00 Total Market Value 0.00 0.00 0.00 0.00 0.00 0.00 0.00 0.00 0.00 0.00 0.00 0.00 0 0 (Raised and Purchased) Average Market Number Weight Price Per Animals in Pounds Pound 0 0.0 0.00 0 0.0 0.00 0 0.0 0.00 0 0.0 0.00 0 0.0 0.00 0 0.0 0.00 0 0.0 0.00 0 0.0 0.00 0 0.0 0.00 0 0.0 0.00 0 0.0 0.00 0 0.0 0.00 0 0.0 0.00 Total Fair Market Value of Raised Livestock Average Cost Market Number Weight Per Price Per Total Animals in LBs Pound Pound Cost 0 0.0 0.00 0.00 0.00 0 0.0 0.00 0.00 0.00 0 0.0 0.00 0.00 0.00 0 0.0 0.00 0.00 0.00 0 0.0 0.00 0.00 0.00 0 0.0 0.00 0.00 0.00 0 0.0 0.00 0.00 0.00 0 0.0 0.00 0.00 0.00 0 0.0 0.00 0.00 0.00 0 0.0 0.00 0.00 0.00 0 0.0 0.00 0.00 0.00 0 0.0 0.00 0.00 0.00 Cost Value of Purchased Livestock for Sale 0 Fair Market Value of Purchased Livestock for Sale Total Market Value 0.00 0.00 0.00 0.00 0.00 0.00 0.00 0.00 0.00 0.00 0.00 0.00 0.00 0 Total Market Value 0.00 0.00 0.00 0.00 0.00 0.00 0.00 0.00 0.00 0.00 0.00 0.00 0 Schedule J -- Breeding Livestock (Raised and Purchased) Raised Breeding Lvstk Use Conservative Market Value for Basis Description Cows 3 + years old Bred Heifers Weaned Heifer Calves Number Animals 167 38 74 0 0 0 0 0 0 0 0 0 0 Total Fair Market Value of Raised Breeding Stock Purchased Average Cost Breeding Lvstk Number Weight/ Per Accum. Description Animals Animal Animal Dep. Midland Bull Test 4/8/94 2 0.0 2,250.00 3,015.00 Richard Thomas 12/5/94 1 0.0 2,000.00 680.00 Rice bulls 12/28/94 1 0.0 1,500.00 510.00 Orman Bull 11/16/94 1 0.0 1,700.00 578.00 Prior to 1994 bulls 1 0.0 1,500.00 1,500.00 0 0.0 0.00 0.00 MSLA Herf. 2/13/95 2 0.0 975.00 663.00 0 0.0 0.00 0.00 0 0.0 0.00 0.00 0 0.0 0.00 0.00 0 0.0 0.00 0.00 0 0.0 0.00 0.00 0 0.0 0.00 0.00 Total Cost or Book Value of Purchased Breeding Stock 6,946 Total Market Value of Purchased Breeding Livestock Wieght Mrkt Value Total Per (Basis) Market Animal Per Animal Value 0.0 500.00 83,500.00 0.0 500.00 19,000.00 0.0 500.00 37,000.00 0.0 0.00 0.00 0.0 0.00 0.00 0.0 0.00 0.00 0.0 0.00 0.00 0.0 0.00 0.00 0.0 0.00 0.00 0.0 0.00 0.00 0.0 0.00 0.00 0.0 0.00 0.00 0.0 0.00 0.00 139,500 Market Total Original Value Per Market Cost Animal Value 4,500.00 500.00 1,000.00 2,000.00 500.00 500.00 1,500.00 500.00 500.00 1,700.00 500.00 500.00 1,500.00 500.00 500.00 0.00 0.00 0.00 1,950.00 500.00 1,000.00 0.00 0.00 0.00 0.00 0.00 0.00 0.00 0.00 0.00 0.00 0.00 0.00 0.00 0.00 0.00 0.00 0.00 0.00 13,150 4,000 Schedule K -- Machinery, Trucks, Pickups, Autos and Livestock Equipment Powered Equipment Cat, D8 Intl/4420009000056253 Tractor, Kubota/050218 Tractor, Int'L 885/B6502180026 Tractor, Int'L-186/2690012V8742 Swather, Hesston6550/655-2032 Cultivator, Intrental 315 Big Boss 6x6 Year Make Model Date Percent Acqurd Owned 07/90 100 07/90 100 07/90 100 07/90 100 07/90 100 07/90 100 1995 05/01/95 100 100 100 100 Year Make Model Cost or Basis 9,000.00 14,000.00 27,500.00 9,500.00 12,500.00 3,250.00 5,108.00 Annual Deprec. 900.00 1,400.00 2,750.00 950.00 1,250.00 325.00 510.80 Estimated Accum. Book Market Deprec. Value Value 5,400.00 3,600.00 3,600.00 8,400.00 5,600.00 5,600.00 16,500.00 11,000.00 11,000.00 5,700.00 3,800.00 3,800.00 7,500.00 5,000.00 5,000.00 1,950.00 1,300.00 1,300.00 510.80 4,597.20 4,597.20 0.00 0.00 0.00 Implements Deere Baler Disc, Ezee-on 12'6" 8347 Loader, Westendorf WL24 Loader, Farmhand190/F495A-850 Loader, G.B. Truck Mounted Superslicer, Deweze/SS 4005 Baler, John D346/1358501E Land Plane, J.Deere/000338 Land Roller- 12ft Farm tools, United 3-3T Blade Rock Picker, DegelmanR570R 3789 Backhoe, Kelly/832196-001103 Grain Drill, Intl510/510c1111 Blade, Degelman 9' 9884 Date Percent Acqurd Owned 1991 100 07/90 100 07/90 100 07/90 100 07/90 100 07/90 100 07/90 100 07/90 100 07/90 100 07/90 100 07/90 100 07/90 100 07/90 100 07/90 100 Cost or Annual Basis Deprec. 17,398.00 1,739.80 1,200.00 120.00 3,900.00 390.00 5,000.00 500.00 2,500.00 250.00 1,800.00 180.00 2,500.00 250.00 1,900.00 190.00 1,500.00 150.00 1,850.00 185.00 2,800.00 280.00 3,500.00 350.00 2,500.00 250.00 1,000.00 100.00 Accum. Deprec. 8,699.00 720.00 2,340.00 3,000.00 1,500.00 1,080.00 1,500.00 1,140.00 900.00 1,110.00 1,680.00 2,100.00 1,500.00 600.00 Book Value 8,699.00 480.00 1,560.00 2,000.00 1,000.00 720.00 1,000.00 760.00 600.00 740.00 1,120.00 1,400.00 1,000.00 400.00 Year Pickups & Make Trucks Model Pickup, Dodge/1B7GR14XOJS731941 Pickup, Dodge/1B7KW24T6BS161872 Pickup, Dodge 2T/D61FL4J005994 Jeep-CI7 Pickup 1 Pickup 2 Date Percent Acqurd Owned 07/90 100 07/90 100 07/90 100 1994 100 1994 100 1994 100 Cost or Annual Basis Deprec. 9,500.00 950.00 1,500.00 150.00 3,000.00 300.00 3,000.00 300.00 1,000.00 100.00 1,000.00 100.00 Accum. Deprec. 5,700.00 900.00 1,800.00 600.00 200.00 200.00 Book Value 3,800.00 600.00 1,200.00 2,400.00 800.00 800.00 0.00 0.00 0.00 Livestock Post Pounder Weed Sprayer 6x6 Hesston Chopper Year Make Model Date Percent Acqurd Owned 07/01/95 100 05/01/95 100 1990 1990 100 100 100 100 Cost or Annual Accum. Basis Deprec. Deprec. 1,645.00 164.50 164.50 600.00 60.00 60.00 9,500.00 950.00 5,700.00 Total Cost or Basis 160,951 Total Annual Depreciation 16,095 Total Accumulated Depreciation To Date 89,154 Total Book Value of Machinery and Equipment Total Estimated Market Value of Machinery and Equipment Book Value 1,480.50 540.00 3,800.00 0.00 0.00 0.00 0.00 Estimated Market Value 8,699.00 480.00 1,560.00 2,000.00 1,000.00 720.00 1,000.00 760.00 600.00 740.00 1,120.00 1,400.00 1,000.00 400.00 Estimated Market Value 3,800.00 600.00 1,200.00 2,400.00 800.00 800.00 Estimated Market Value 1,480.50 540.00 3,800.00 0.00 0.00 0.00 0.00 71,797 71,797 Schedule L -- Real Estate Owned Descrip. Bare Land Hayland Grazing Land Timberland Percent Date Owned Acquir. 100 06/90 100 06/90 100 06/90 Percent Buildings Owned Market Value of Out Bldgs 100 Quonset type garage 100 Old log cabin 100 Storage building, post metal covering 100 Shop, insulated concrete floor 100 Barn, frame old obsolete 100 Feed shed frame 100 Calving shed large, post, metal covered100 Hay shed 100 Hay shed with feder and livestock chute 100 Hay shed 100 Improvements Percent Owned Acres 383.47 1204.1 1827 Date Acquir. Acres 01/90 01/90 01/90 01/90 01/90 01/90 01/90 01/90 01/90 01/90 . 01/90 Date Acquir. Acres Cost or Annual Basis Dep. 210,925 180,618 200,970 Accum. Dep. Cost or Basis Accum. Dep. 2,700 300 8,400 9,720 4,500 400 12,800 3,800 4,150 3,350 Cost or Basis Annual Dep. 135 15 420 486 225 20 640 190 208 168 Annual Dep. 810 90 2,520 2,916 1,350 120 3,840 1,140 1,245 1,005 Accum. Dep. Estimated Book Market Value Value 210,925 325,950 180,618 1,023,502 200,970 1,552,950 0 0 0 0 0 0 0 0 Book Value 0 1,890 210 5,880 6,804 3,150 280 8,960 2,660 2,905 2,345 Book Value Market Value 50,000 Market Value 0 0 0 0 0 0 0 0 Houses House 100 01/90 22500 22500 0 0 Total Acres 3,415 Total Cost or Basis 665,133 Total Annual Depreciation 2,506 Total Accumulated Depreciation on R. E. Total Book Value of Real Estate Total Estimated Market Value of Real Estate Leased and Rented Land Description / Landlord Champion International Type of Lease Lease Date Expires Acres 1,040.00 Total Acres Rented 1,040 Total Annual Cash Rents and Leases Current Accrued Rent and Lease Payments 22500 15,036 650,097 2,974,902 Current Accrued Annual Portion Rent and Cash Rent/Lease Lease Rent Due Payments 650.00 270.83 270.83 0.00 0.00 0.00 0.00 0.00 0.00 0.00 0.00 650 271 Schedule M -- Securities Not Readily Marketable Number of Description Market Price Unit Market Value of Non-Marketable Securities Value of Farm Portion (Cost & Market) Fair Market Cost Non-Farm 0 0 0 0 0 0 0 0 0 0 0 0 0 0% 0 0% 0 0% 0 0% Schedule N -- Non-Farm Assets Fair Market Value Total Cost & Market Value of Non-Farm Assets Insurance Beneficiary 0 Yearly Premium 0 Cash Value Schedule O -- Farm Accounts Payable Purpose of Account Payable To Current Balance Principle Due in 12 Mo. Total Current Balance 0 Principle Due Within 12 Months Total Principle Due Beyound 12 Months Total Accrued Interest Due Within 12 Months Due Beyound 12 Mo. Accrued Interest 0 0 0 Schedule P -- Liens and Judgements Owed Principle Amount Description Total Principle on Liens and Judgements Total Accrued Interest on Leins and Judgements Accured Interest 0 0 Schedule Q -- Notes Payable Owed To Purpose Current Balance Total Current Balance on Notes 0 Total Principle Due in 12 Months Total Principle Due Beyound 12 Months on Notes Total Accrued Interest Due Within 12 Months Principle Due Due in Beyound 12 Mo. 12 Mo. Accrued Interest 0 0 0 Schedule R -- Intermediate Loans Owed To Norwest Bank Princ. Due Curret Due in Beyound Accrued Balance 12 Mo. 12 Mo. Interest 3,939.00 3,939.00 0.00 130.50 0.00 0.00 0.00 0.00 0.00 0.00 0.00 0.00 0.00 0.00 0.00 0.00 0.00 0.00 Total Current Balance (Inter.) 3,939 Total Principle Balance Due in 12 Mo. 3,939 Total Principle Balance Due Beyound 12 Mo. 0 Total Accrued Interest on Intermediate Loans Due in 12 Months 131 Descrip. or Purpose Baler Schedule S -- Long Term Loans Owed To Descrip. or Purpose Curret Balance Princ. Due in 12 Mo. Total Current Balance (L. T.) 0 Total Principle Balance Due Within 12 Mo. 0 Total Principle Balance Due Beyound 12 Mo. Total Accrued Interest on Long Term Loans Due in 12 Months Due Beyound Accrued 12 Mo. Interest 0.00 0.00 0.00 0.00 0.00 0.00 0.00 0.00 0.00 0.00 0.00 0.00 0.00 0.00 0.00 0 0 Schedule T -- Taxes - (Real Estate, Income, Property, S.S.) Real Estate Real Estate Date Due Accrued Real Estate Taxes Due Within 12 Months Personal Property Date Due Annual Real Estate Tax 675 Annual Accrued Personal Personal Prop. Tax Prop. Tax Accrued Personal Property Tax Due Within 12 Months Payroll Taxes Accrued Payroll Tax Due Within 12 Months Accrued R. E. Tax 675.00 0 Date Due 0 Accrued Payroll Taxes 0 Current and Non Current Deferred Tax Calculations SPA NCBA Case Ranch Current Portion of Deferred Taxes @ Market Value Current Assets Prepaid Expenses (Sch. B) Growing Crops (Sch. C) Accounts Receivable (Sch. D) Notes Receivable (Sch D) Government Payments Receivable (Sch D) PIK Certificates (Sch E) Securities Readily Marketable, Farm (Sch. F) Crops For Sale & Feed (Sch. G) Crops Under Gov. Loan (Sch. H) Value of Lvstck Held for Sale (Sch I) Futures or Options Account Equity (Net Equity) Other Other Total Market Value Total Tax Basis Value Excess of Market Value Over Tax Basis December 31, 1995 Market Value 650 0 0 0 0 0 0 37500 0 0 0 0 0 38150 Cost or Tax Basis 0 0 0 0 0 0 0 0 0 0 0 0 0 0 38150 Deductions (Liabilities that result in tax deductions when paid) Farm Accounts Payable (Sch. O) 0 Accrued Interest (Schedules O,P,Q,R,S) 130.5 Personal property taxes (Sch T) 0 Real estate Taxes (Sch T) 675 Accrued Lease Payments (Land Only) (Sch L) 270.8333 Other Accrued Expenses 0 Employee Payroll Withholdings (Payroll Taxes) 0 Other Accrued Expenses 0 Other Accrued Expenses 0 Other Accrued Expenses 0 Total Deductions 1076.333333 Deferred Income Related to Current Assets & Liabilities Minus Net Operating Loss Carry Forward Deferred Taxable Income Related to Current Assets & Liabilites Federal Marginal Income Tax Rate State Marginal Income Tax Rate Local Marginal Income Tax Rate Self Employment Tax Rate (Limited by Max) Old-age, Survivor, & Disability Portion of SE Tax Rate Medicare (Hospital Insurance) Portion Maximum Dollar Amount for Self Employment Tax Marginal Tax Rate 0% 0% 0% Deferred Tax Estimate on Current Assets & Liabilities (Market) 0.00% 0.00% 0 37073.67 0 37074 Estimated Tax 0 0 0 0 0 Current Assets Prepaid Expenses (Sch. B) Growing Crops (Sch. C) Accounts Receivable (Sch. D) Notes Receivable (Sch D) Government Payments Receivable (Sch D) PIK Certificates (Sch E) Securities Readily Marketable, Farm (Sch. F) Crops For Sale & Feed (Sch. G) Crops Under Gov. Loan (Sch. H) Value of Lvstck Held for Sale (Sch I) Other Other Other Total Cost/Book Value Total Tax Basis Value Excess of Cost/Book Value Over Tax Basis Cost Value Tax Basis 650 0 0 0 0 0 0 37500 0 0 0 0 0 38150 0 0 0 0 0 0 0 0 0 0 0 0 0 0 38150 Deductions (Liabilities that result in tax deductions when paid) Farm Accounts Payable (Sch. O) Accrued Interest (Schedules O,P,Q,R,S) Personal property taxes (Sch T) Real estate Taxes (Sch T) Accrued Lease Payments (Land Only) (Sch L) Other Accrued Expenses Other Accrued Expenses Other Accrued Expenses Other Accrued Expenses Other Accrued Expenses Total Deductions 0 131 0 675 271 0 0 0 0 0 1076 Deferred Taxable Income Related to Current Assets & Liabilities Minus Net Operating Loss Carry Forward Deferred Taxable Income Related to Current Assets & Liabilites Federal Estimated Income Tax Rate State Estimated Income Tax Rate Local Estimated Income Tax Rate Estimated Self Employment Tax Rate (Limited) Old-age, Survivor, & Disability Portion of SE Tax Rate Medicare (Hospital Insurance) Portion Maximum Dollar Amount for Self Employment Tax Marginal Tax Rate 0% 0% 0% Deferred Tax Estimate on Current Assets & Liabilities (Cost) 0.00% 0.00% 0 37074 0 37074 Estimated Tax 0 0 0 0 0 Noncurrent Portion of Deferred Taxes Cost or Tax Basis 145704 -139500 71797 650097 0 0 Market Value 143500 Total Noncurrent Farm Assets Breeding Stock (Sch J) Adjust Breeding Lvstk Cost Basis (FFSG) Farm Machinery & Equipment (Sch K) 71797 Farm Real Estate (Sch L) 2974902 Other Non-Current Assets 0 Other Non-Current Assets 0 Total Market Value of Noncurrent Assets 3190198 Total Cost or Book Value of Noncurrent Assets 728098 Excess of Market Value over Tax Basis on Noncurrent Assets 2462101 Deductions-Noncurrent-(Liabilities that result in tax deductions when paid) Other Noncurrent Deductions... 0 Other Noncurrent Deductions... 0 Other Noncurrent Deductions... 0 Other Noncurrent Deductions... 0 Other Noncurrent Deductions... 0 Total Deductions for Noncurrent 0 Deferred Income Related to Noncurrent Assets & Liabilities Minus Net Operating Loss Carry Forward (Not Used In Current Section) Deferred Taxable Income for Noncurrent Assets & Liabilities Federal Estimated Income Tax Rate State Estimated Income Tax Rate Total Deferred Tax Estimate Related to Noncurrent Assets and Liabilities Marginal Tax Rate 0% 0% 2462101 0 2462101 Estimated Tax 0 0 0
