ME 4710 Motion and Control What is a Root Locus Diagram?
advertisement
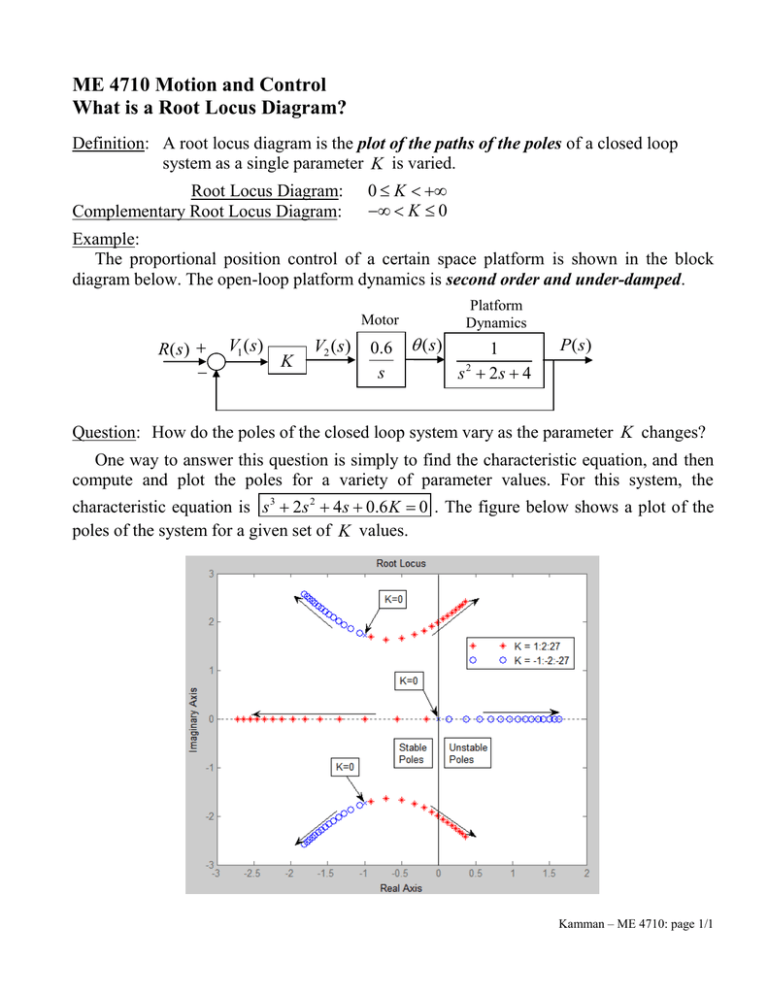
ME 4710 Motion and Control What is a Root Locus Diagram? Definition: A root locus diagram is the plot of the paths of the poles of a closed loop system as a single parameter K is varied. Root Locus Diagram: Complementary Root Locus Diagram: 0 K K 0 Example: The proportional position control of a certain space platform is shown in the block diagram below. The open-loop platform dynamics is second order and under-damped. Platform Dynamics Motor R( s ) V1 ( s) K V2 (s) 0.6 s ( s) 1 s 2 2s 4 P( s ) Question: How do the poles of the closed loop system vary as the parameter K changes? One way to answer this question is simply to find the characteristic equation, and then compute and plot the poles for a variety of parameter values. For this system, the characteristic equation is s 3 2s 2 4s 0.6 K 0 . The figure below shows a plot of the poles of the system for a given set of K values. Kamman – ME 4710: page 1/1
