Homework 6 Due October 16, 2009 Exercise 1, page 197 True or False?
advertisement
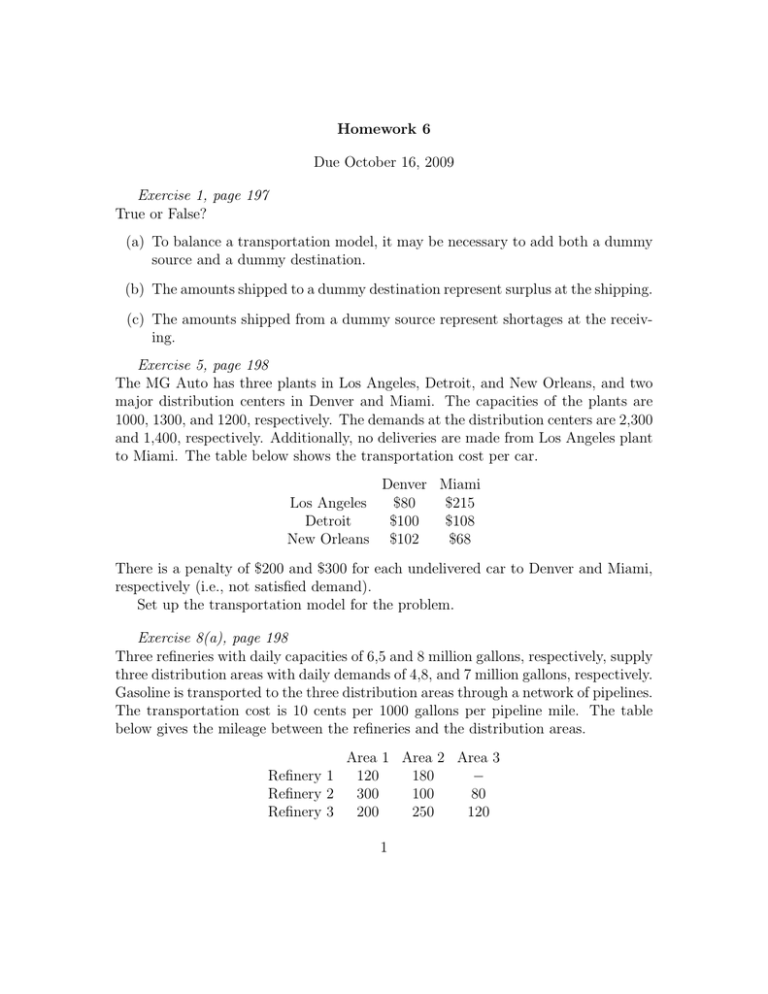
Homework 6 Due October 16, 2009 Exercise 1, page 197 True or False? (a) To balance a transportation model, it may be necessary to add both a dummy source and a dummy destination. (b) The amounts shipped to a dummy destination represent surplus at the shipping. (c) The amounts shipped from a dummy source represent shortages at the receiving. Exercise 5, page 198 The MG Auto has three plants in Los Angeles, Detroit, and New Orleans, and two major distribution centers in Denver and Miami. The capacities of the plants are 1000, 1300, and 1200, respectively. The demands at the distribution centers are 2,300 and 1,400, respectively. Additionally, no deliveries are made from Los Angeles plant to Miami. The table below shows the transportation cost per car. Denver Miami Los Angeles $80 $215 Detroit $100 $108 New Orleans $102 $68 There is a penalty of $200 and $300 for each undelivered car to Denver and Miami, respectively (i.e., not satisfied demand). Set up the transportation model for the problem. Exercise 8(a), page 198 Three refineries with daily capacities of 6,5 and 8 million gallons, respectively, supply three distribution areas with daily demands of 4,8, and 7 million gallons, respectively. Gasoline is transported to the three distribution areas through a network of pipelines. The transportation cost is 10 cents per 1000 gallons per pipeline mile. The table below gives the mileage between the refineries and the distribution areas. Area 1 Area 2 Area 3 Refinery 1 120 180 − Refinery 2 300 100 80 Refinery 3 200 250 120 1 rE"tl^) 6otow 5o,mo I !" bo 9 2r tusr@o tto 4 2'l t.8 tf Lo,N ,9 Figure 1: Pipeline network. Refinery 1 is not connected to distribution area 3. Construct the associated transportation model. Exercise 9(a), page 199 In the preceding problem, suppose that the capacity of refinery 3 is 6 million of gallons only and that distribution area 1 must receive all of its demand. Additionally, any shortage at areas 2 and 3 will incur a penalty of 5 cents per gallon. Formulate the problem as a transportation model. Exercise 5, page 232 Consider the oil pipeline network shown in Figure 1. The different nodes represent pumping and receiving stations. Distances are in miles between the stations (shown on the links). The transportation cost per gallon between two nodes is directly proportional to the length of the pipeline. Develop the associated transshipment model. 2
