Understanding Short-Run and Long-Run Average Cost Curves
advertisement
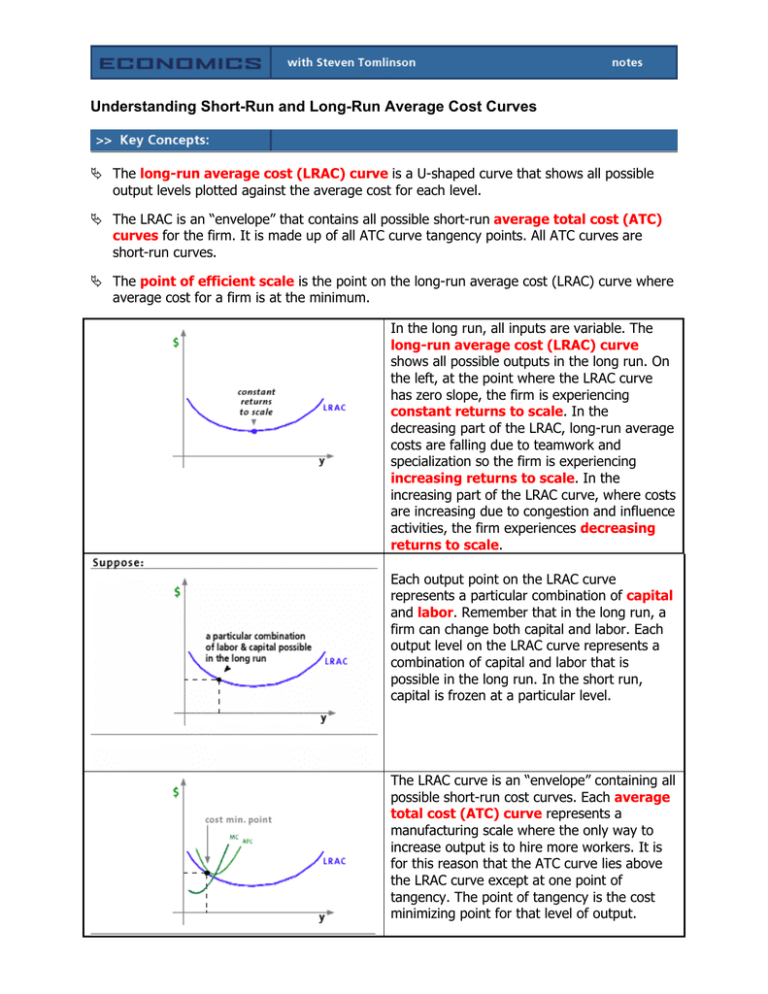
Understanding Short-Run and Long-Run Average Cost Curves The long-run average cost (LRAC) curve is a U-shaped curve that shows all possible output levels plotted against the average cost for each level. The LRAC is an “envelope” that contains all possible short-run average total cost (ATC) curves for the firm. It is made up of all ATC curve tangency points. All ATC curves are short-run curves. The point of efficient scale is the point on the long-run average cost (LRAC) curve where average cost for a firm is at the minimum. In the long run, all inputs are variable. The long-run average cost (LRAC) curve shows all possible outputs in the long run. On the left, at the point where the LRAC curve has zero slope, the firm is experiencing constant returns to scale. In the decreasing part of the LRAC, long-run average costs are falling due to teamwork and specialization so the firm is experiencing increasing returns to scale. In the increasing part of the LRAC curve, where costs are increasing due to congestion and influence activities, the firm experiences decreasing returns to scale. Each output point on the LRAC curve represents a particular combination of capital and labor. Remember that in the long run, a firm can change both capital and labor. Each output level on the LRAC curve represents a combination of capital and labor that is possible in the long run. In the short run, capital is frozen at a particular level. The LRAC curve is an “envelope” containing all possible short-run cost curves. Each average total cost (ATC) curve represents a manufacturing scale where the only way to increase output is to hire more workers. It is for this reason that the ATC curve lies above the LRAC curve except at one point of tangency. The point of tangency is the cost minimizing point for that level of output. The short-run ATC curves represent different scales of plant that cannot be changed in the short run. They are all above the LRAC because firms have less flexibility in the short run and costs are higher. Each tangency point is the cost-minimizing point for that level of output. 1 The LRAC for most firms is U-shaped reflecting first, increasing returns to scale; at some point constant returns to scale; and finally, decreasing returns to scale. On the left, you can see the shape of the LRAC. On the LRAC, there is at least one point where a tangent line has a slope of zero. This is the point where long-run average costs are at the lowest for the firm. On the left, the tangent line is horizontal at the point on the LRAC curve where the slope is zero. The output and cost combination where the firm is experiencing constant returns to scale is called the point of efficient scale. In the long run, the firm can do no better than this combination because at no other point in the long run can its average, or per unit cost, become less.
