Document 10283322
advertisement
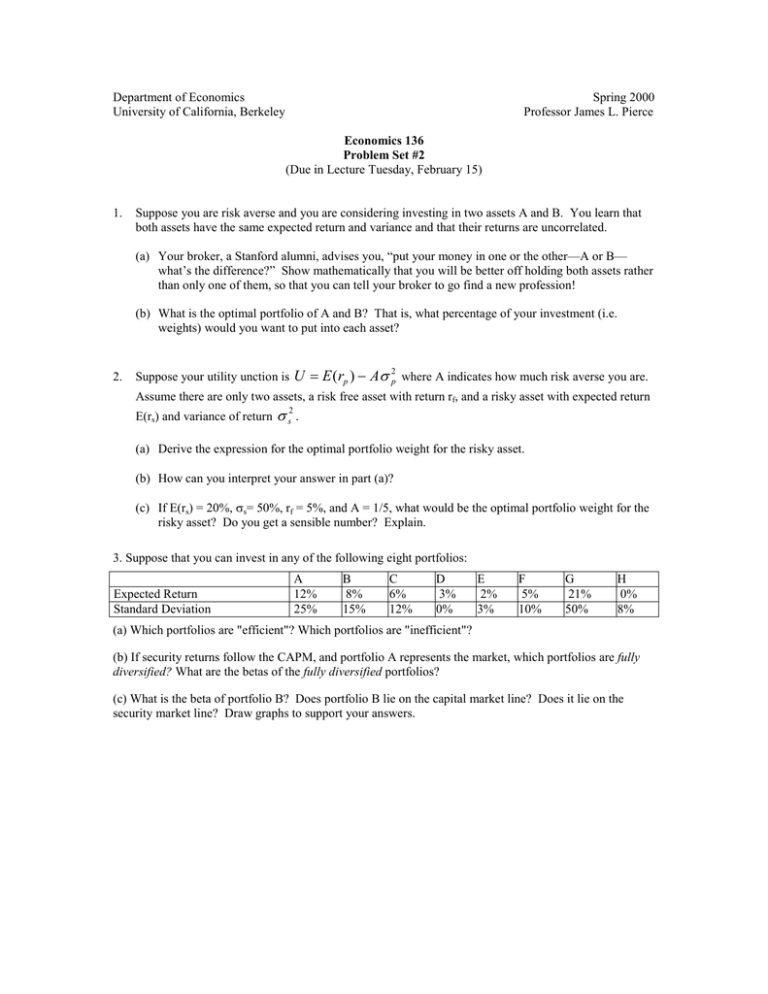
Department of Economics University of California, Berkeley Spring 2000 Professor James L. Pierce Economics 136 Problem Set #2 (Due in Lecture Tuesday, February 15) 1. Suppose you are risk averse and you are considering investing in two assets A and B. You learn that both assets have the same expected return and variance and that their returns are uncorrelated. (a) Your broker, a Stanford alumni, advises you, “put your money in one or the other—A or B— what’s the difference?” Show mathematically that you will be better off holding both assets rather than only one of them, so that you can tell your broker to go find a new profession! (b) What is the optimal portfolio of A and B? That is, what percentage of your investment (i.e. weights) would you want to put into each asset? 2. Suppose your utility unction is U = E (rp ) − Aσ 2p where A indicates how much risk averse you are. Assume there are only two assets, a risk free asset with return rf, and a risky asset with expected return E(rs) and variance of return σ s2 . (a) Derive the expression for the optimal portfolio weight for the risky asset. (b) How can you interpret your answer in part (a)? (c) If E(rs) = 20%, σs= 50%, rf = 5%, and A = 1/5, what would be the optimal portfolio weight for the risky asset? Do you get a sensible number? Explain. 3. Suppose that you can invest in any of the following eight portfolios: Expected Return Standard Deviation A 12% 25% B 8% 15% C 6% 12% D 3% 0% E 2% 3% F 5% 10% G 21% 50% H 0% 8% (a) Which portfolios are "efficient"? Which portfolios are "inefficient"? (b) If security returns follow the CAPM, and portfolio A represents the market, which portfolios are fully diversified? What are the betas of the fully diversified portfolios? (c) What is the beta of portfolio B? Does portfolio B lie on the capital market line? Does it lie on the security market line? Draw graphs to support your answers. 4. Suppose the universe of available investments consists of the following three assets, whose risk and returns are: A B C Expected Return 5% 10% 15% Standard Deviation 0% 15% 40% Assets B and C are perfectly positively correlated. (a) Considering only the risky assets B and C, find and graph the efficient frontier assuming that no short-sales of risky assets are allowed. (b) If investors can sell short the risk free asset (i.e. they can borrow at the risk free rate), show in a graph all of the ways in which the risk free asset can be combined with a portfolio of risky assets. What will be the efficient frontier? (c) Based on your answer to part (b), can you say if the asset markets are in equilibrium? (d) How would your answers change if investors are allowed to short sell the risky assets too? 5. (Using CAPM to price securities) By definition, a security's expected return over a period is E (r ) = E ( Pt +1 + d t +1 ) − Pt , where Pt is the current price of the security, and E(Pt+1 + dt+1 ) is the Pt expected price and dividend payment next period. This equation can be rearranged as Pt = E ( Pt +1 ) + E (d t +1 ) , which can be interpreted as showing that the current price of the security is the 1 + E (r ) security's expected payoff next period discounted by the expected or required rate of return. If dividends are expected to grow at a constant rate in the future, it can be shown (consult BKM, pgs. 533-535 for details) that Pt = E (dt +1 ) , where g is the constant growth rate. Now answer the following question: E (r ) − g Suppose that the ACME Widget Corporation is expected to pay a dividend of $4 a share next year, and that thereafter its dividend is expected to grow at 7% per year; suppose further that the risk-free rate is 3%, the market required rate of return is 10%, and that ACME Widget has a beta of two. What does the CAPM predict for the current price of a share of the ACME Widget Corporation?

