Commonality Analysis
advertisement
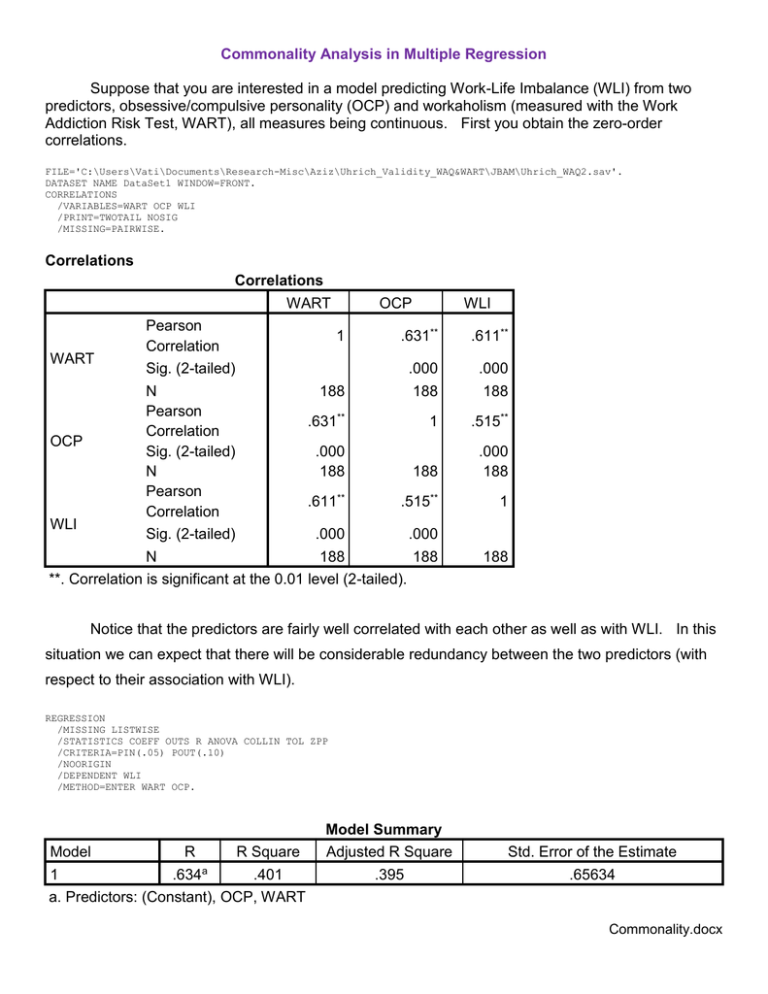
Commonality Analysis in Multiple Regression Suppose that you are interested in a model predicting Work-Life Imbalance (WLI) from two predictors, obsessive/compulsive personality (OCP) and workaholism (measured with the Work Addiction Risk Test, WART), all measures being continuous. First you obtain the zero-order correlations. FILE='C:\Users\Vati\Documents\Research-Misc\Aziz\Uhrich_Validity_WAQ&WART\JBAM\Uhrich_WAQ2.sav'. DATASET NAME DataSet1 WINDOW=FRONT. CORRELATIONS /VARIABLES=WART OCP WLI /PRINT=TWOTAIL NOSIG /MISSING=PAIRWISE. Correlations Correlations WART Pearson Correlation OCP WLI .631** .611** Sig. (2-tailed) .000 N 188 188 Pearson .631** 1 Correlation OCP Sig. (2-tailed) .000 N 188 188 Pearson .611** .515** Correlation WLI Sig. (2-tailed) .000 .000 N 188 188 **. Correlation is significant at the 0.01 level (2-tailed). .000 188 WART 1 .515** .000 188 1 188 Notice that the predictors are fairly well correlated with each other as well as with WLI. In this situation we can expect that there will be considerable redundancy between the two predictors (with respect to their association with WLI). REGRESSION /MISSING LISTWISE /STATISTICS COEFF OUTS R ANOVA COLLIN TOL ZPP /CRITERIA=PIN(.05) POUT(.10) /NOORIGIN /DEPENDENT WLI /METHOD=ENTER WART OCP. Model 1 R .634a R Square .401 Model Summary Adjusted R Square .395 Std. Error of the Estimate .65634 a. Predictors: (Constant), OCP, WART Commonality.docx 2 Model Regression Residual Total 1 Sum of Squares 53.442 79.694 133.136 ANOVAa df 2 185 187 Mean Square 26.721 .431 F 62.030 Sig. .000b a. Dependent Variable: WLI b. Predictors: (Constant), OCP, WART Coefficientsa Unstandardized Coefficients Model B (Constant) WART OCP 1 -.336 .846 1.184 Std. Error .263 .130 .405 Standardized Coefficients Beta .476 .215 t Sig. -1.278 6.495 2.928 .203 .000 .004 Coefficientsa Model 1 Correlations Zero-Order Semi-Partial (Constant) WART OCP .611 .515 Collinearity Statistics Tolerance VIF .369 .167 .602 .602 a. Dependent Variable: WLI Notice that for both predictors the semipartial coefficient is considerably lower than the zero-order coefficient. a+b+c+d=1 rY21 b c sr12 b b (a b c d ) 1 rY22 d c r122 c e RY212 b c d c = redundancy (aka communality) 1.660 1.660 3 Although not commonly done, it might be informative to estimate the size of area c, the redundancy between the predictors with respect to their association with Y. For a trivariate regression, here is how to estimate that proportion of variance: c rY21 rY22 RY212 -- that is, (b+c) + (c+d) – (b+c+d). For our data, that is .6112 + .5152 - .401 = .2375. Alternatively, c RY212 sr12 sr22 .401 .3692 .1672 .2370 . If you wish to test whether this commonality differs significantly from zero, you can construct a t test like this: Multiply the squared commonality coefficient by the corrected total sum of squares in Y. For our data, .237(133.136) = 31.55. Divide this mean square (df = 1) by the residual mean square to 31.55 obtain F. Take the square root of that F to obtain t. For our data, t 8.556 . .431 Because the coefficients were rounded to three digits, there may be a little rounding error here. If you suffer from obsessive/compulsive disorder, that probably concerns you. Either take a selective serotonin reuptake inhibitor or get the sums of squares with more precision, as shown below. REGRESSION /MISSING LISTWISE /STATISTICS COEFF OUTS R ANOVA /CRITERIA=PIN(.05) POUT(.10) /NOORIGIN /DEPENDENT WLI /METHOD=ENTER WART. Model Sum of Squares Regression 49.749 1 Residual 83.387 Total 133.136 a. Dependent Variable: WLI b. Predictors: (Constant), WART ANOVAa df 1 186 187 Mean Square 49.749 .448 F 110.968 Sig. .000b Mean Square 35.271 .526 F 67.036 Sig. .000b REGRESSION /MISSING LISTWISE /STATISTICS COEFF OUTS R ANOVA /CRITERIA=PIN(.05) POUT(.10) /NOORIGIN /DEPENDENT WLI /METHOD=ENTER OCP. Model 1 Regression Residual Total Sum of Squares 35.271 97.864 133.136 a. Dependent Variable: WLI ANOVAa df 1 186 187 b. Predictors: (Constant), OCP 4 SSCommonalit y SSY 1 SSY 2 SSY 12 49.749 35.271 53.442 31.578 . Of all the variance in Y, 31.578/133.136 = 23.72 % is common to X1 and X2. To test the null that commonality = 0, t (185) MSCommonalit y MSError 31.578 8.560 , p < .001. .431 In December or 2102, a correspondent asked me “If the r2 between variable X1 and Y = a and the sr2 between the same two variables, with variable X2 partialled out, is sr2 = b, what is the appropriate test to determine if these two correlations are significantly different? My response: “If you look back at the Venn Diagram above, you will see that the difference between sr2 for X1 and r2 for X1 is area c, the commonality for the two predictors. The appropriate test is that I have outlined above.” Recommended Reading: Zientek, L. R. & Thompson, B. (2006). Commonality analysis: Partitioning variance to facilitate better understanding of data. Journal of Early Intervention, 28, 299-307. Karl L. Wuensch, December, 2012 Return to Wuensch’s Stats Lessons
