16. Telekom Malaysia Berhad conducted a study on the amount of
advertisement
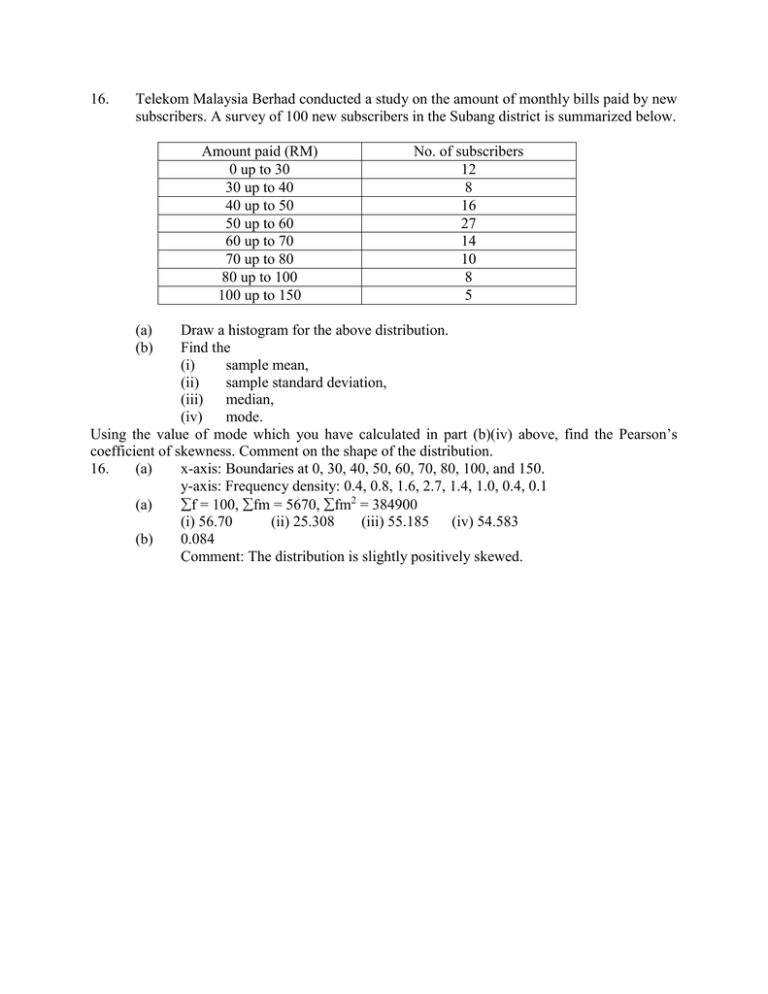
16. Telekom Malaysia Berhad conducted a study on the amount of monthly bills paid by new subscribers. A survey of 100 new subscribers in the Subang district is summarized below. Amount paid (RM) 0 up to 30 30 up to 40 40 up to 50 50 up to 60 60 up to 70 70 up to 80 80 up to 100 100 up to 150 (a) (b) No. of subscribers 12 8 16 27 14 10 8 5 Draw a histogram for the above distribution. Find the (i) sample mean, (ii) sample standard deviation, (iii) median, (iv) mode. Using the value of mode which you have calculated in part (b)(iv) above, find the Pearson’s coefficient of skewness. Comment on the shape of the distribution. 16. (a) x-axis: Boundaries at 0, 30, 40, 50, 60, 70, 80, 100, and 150. y-axis: Frequency density: 0.4, 0.8, 1.6, 2.7, 1.4, 1.0, 0.4, 0.1 (a) f = 100, fm = 5670, fm2 = 384900 (i) 56.70 (ii) 25.308 (iii) 55.185 (iv) 54.583 (b) 0.084 Comment: The distribution is slightly positively skewed.
