MCA- I Mid. Term Examination, April 2013 Subject: Statistical Methods
advertisement
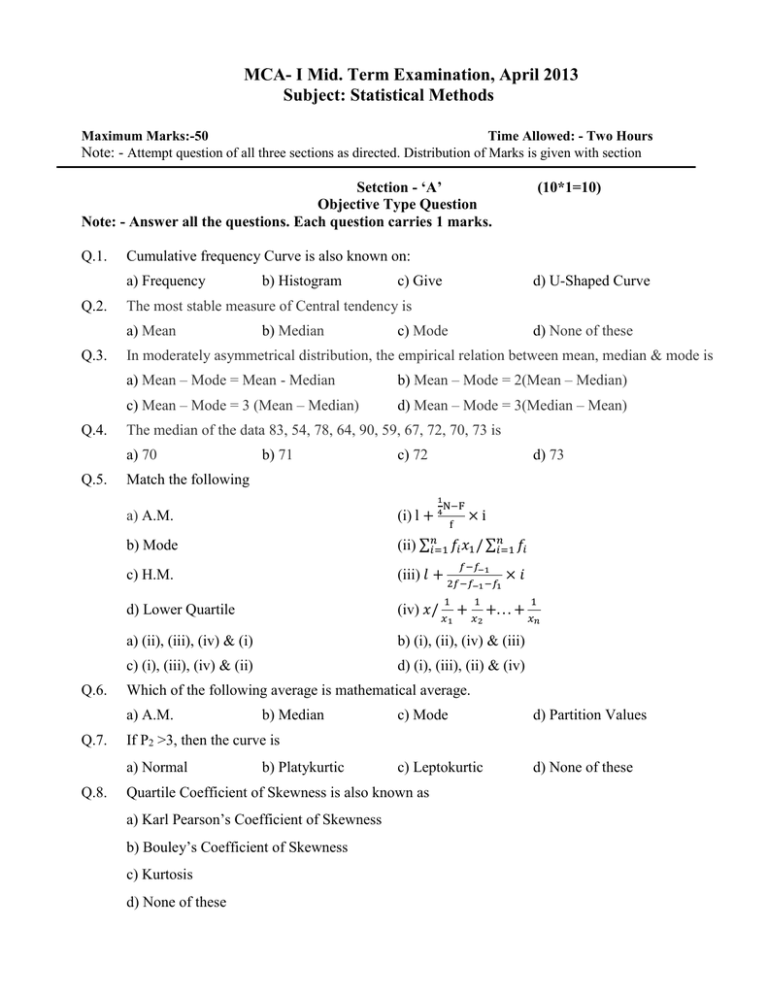
MCA- I Mid. Term Examination, April 2013 Subject: Statistical Methods Maximum Marks:-50 Time Allowed: - Two Hours Note: - Attempt question of all three sections as directed. Distribution of Marks is given with section Setction - ‘A’ Objective Type Question Note: - Answer all the questions. Each question carries 1 marks. Q.1. Cumulative frequency Curve is also known on: a) Frequency Q.2. Q.4. c) Give b) Median c) Mode b) Mean – Mode = 2(Mean – Median) c) Mean – Mode = 3 (Mean – Median) d) Mean – Mode = 3(Median – Mean) The median of the data 83, 54, 78, 64, 90, 59, 67, 72, 70, 73 is b) 71 c) 72 d) 73 Match the following (i) l + 4 b) Mode (ii) ∑𝑛𝑖=1 𝑓𝑖 𝑥1 / ∑𝑛𝑖=1 𝑓𝑖 c) H.M. (iii) 𝑙 + 2𝑓−𝑓 −1−𝑓 × 𝑖 f ×i 𝑓−𝑓 −1 1 1 1 2 1 1 d) Lower Quartile (iv) 𝑥/ 𝑥 + 𝑥 +. . . + 𝑥 a) (ii), (iii), (iv) & (i) b) (i), (ii), (iv) & (iii) c) (i), (iii), (iv) & (ii) d) (i), (iii), (ii) & (iv) 𝑛 Which of the following average is mathematical average. b) Median c) Mode d) Partition Values c) Leptokurtic d) None of these If P2 >3, then the curve is a) Normal Q.8. N−F a) A.M. a) A.M. Q.7. d) None of these a) Mean – Mode = Mean - Median 1 Q.6. d) U-Shaped Curve In moderately asymmetrical distribution, the empirical relation between mean, median & mode is a) 70 Q.5. b) Histogram The most stable measure of Central tendency is a) Mean Q.3. (10*1=10) b) Platykurtic Quartile Coefficient of Skewness is also known as a) Karl Pearson’s Coefficient of Skewness b) Bouley’s Coefficient of Skewness c) Kurtosis d) None of these Q.9. A Variable x takes values 1, 2, 3 ………… n each with frequency unity. The mean of the distribution is: a) 𝑛(𝑛+1) 𝑛 b) 2 2 c) 𝑛+1 d) None of these 2 Q.10. The Karl Pearson’s Coefficient of Skewness value lies between: a) -1 and 1 b) -3 and 3 c) -2 and 2 d) None of these Setction - ‘B’ (Short Answer Type Question) Note: - Answer any two questions. Each question carries 05 marks. Q.1. Q.2. (2*5=10) Find the missing frequencies from the following table: Expension (in Rs.) : 0-20 20-40 40-60 60-80 80-100 No. of families : 14 ? 27 ? 15 The details of runs gained by two batsmen Sachin and yuvi in different innings are as follows: Sachin : 24 79 31 114 14 02 68 01 110 07 Yuvi 05 18 42 53 09 47 52 17 81 56 : Which of the player is better run scorer? Q.3. Write short notes on the following (a) Histogram (b) Kurtosis Setction - ‘C’ (Long Answer Type Question) Note: - Answer any three questions. Each question carries 10 marks. Q.1. (3*10=30) From the following frequency distribution, Computer 4th deale, 3rd Quartile, 94th percentile. Class : 0-4 4-8 8-12 12-14 14-18 18-20 20-25 ≥ 25 Frequency : 10 12 18 7 5 8 4 6 Q.2. In a frequency distribution, the mean is 1.5; Variance is 0.64, 𝛾1 is 0.3 and 𝛽2 is 2.5. Find 𝜇3 and 𝜇4 and also the first four moments about the origin. Q.3. Calculate the Karl Pearson’s Coefficient of skewness for the following frequency distribution Class : 0-5 5-10 10-15 15-20 20-25 25-30 30-35 35-40 Frequency : 5 20 10 0 5 20 8 7 Q.4. Define the skewness and kurtosis of a distribution. The first four moments about the working mean 28.5 of a distribution are 0.294, 7.144, 42.409 and 454.98. Calculate the moment about the mean. Also evaluate 𝛽1 , 𝛽2 and comment upon the skewness and kurtosis of the distribution. Q.5. Compute the mean, mode, S.D, and Coefficient of skewness for the following data: Age Below : 10 20 30 40 50 60 No. of person : 15 32 51 78 97 109
