Week 2C Figures ()
advertisement
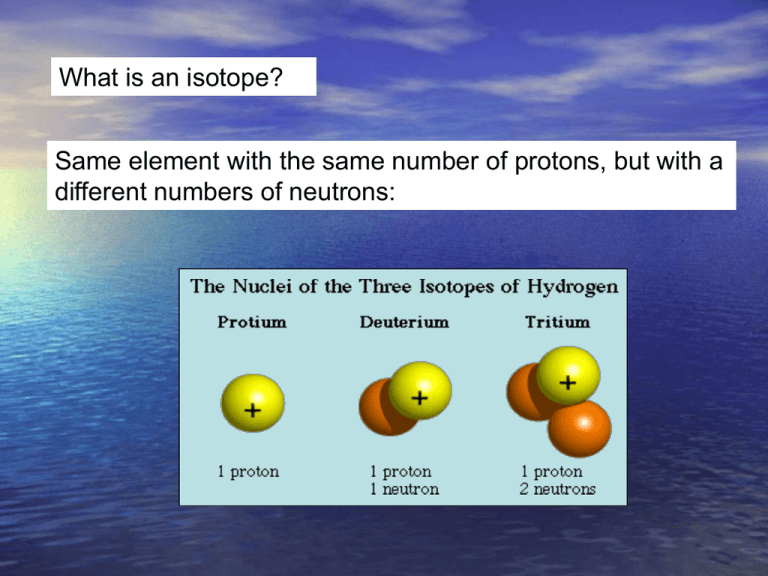
What is an isotope? Same element with the same number of protons, but with a different numbers of neutrons: ELEMENT ISOTOPE HYDROGEN (Z=l) l 2 Stable isotope abundances Out of every 100 atoms of Oxygen, 0.2 atoms would be 18O and the rest would be 16O. CARBON (Z=6) NITROGEN (Z=7) OXYGEN (Z=8) H (Protium) H (D, for Deuterium) ABUNDANCE 99.985 0.015 12 98.9 1.1 14 N 15 N 99.63 0.37 16 99.76 0.04 0.2 C 13 C O 17 O 18 O Fractionation The partitioning of stable isotopes of an element among different coexisting phases is called FRACTIONATION and is a MASS and TEMPERATURE dependent process Fractionation leads to variation in the natural abundances of stable isotopes expressed as differences in ISOTOPE RATIOS, R ALWAYS: R = HEAVY ISOTOPE/ LIGHT ISOTOPE THAT IS: R = RARE ISOTOPE / ABUNDANT ISOTOPE e.g. D/H, 13C/12C, 15N/14N , 18O/16O, 34S/32S Because these ratios are so small, chemists measure 18O/16O (=R), rather than 18O or 16O abundance And then report them as ratios compared to a standard. Definitions - ambiguity “18O-rich” “18O-poor” “heavy oxygen” “light oxygen” “enriched oxygen” “depleted oxygen” “16O-poor” “16O-rich” Reservoir containing both 18O and 16O atoms Original seawater 16O Remove 18O and 16O atoms at a different ratio than the initial reservoir 18O Modified seawater 16O 18O Biology (forams) 16O 18O That changes the ratio of 18O and 16O in the original reservoir. THIS process is temperature dependent. Change the temperature and you extract different isotope ratios from the original reservoir. OXYGEN ISOTOPES AS A PROXY FOR PALEOTEMPERATURE There are two stable isotopes of oxygen used in paleotemperature estimates: 16O (about 99.8% of total) and 18O (most of the rest). There are other oxygen isotopes, but they are not used for paleotemperatures. The ‘normal’ ratio of 18O/16O is about 1/400, so when we express variations in this ratio, it is usually multiplied by a large number (1000), so the values are small whole numbers. Define the d18O ratio as… [note: heavy isotope over light isotope, always] Where (18O/16O)SMOW is a sample of surface ocean where d18O = 0. The ratio Oxygen isotopes 16O and 18O are used a proxy to obtain paleotemperatures in two main environments; 1. From the oxygen obtained from calcium carbonate shells of foraminifera in oceanic sediments, and 2. From the oxygen obtained from ice in Arctic and Antarctic ice cores. In the foram shells in sediments, the ratio of 16O and 18O in the carbonate records that ratio that is present in seawater, modified by the temperature of the sea water (through fractionation of the 18O and 16O isotopes). The 16O and 18O ratio of seawater also depends on the volume of ice sheets that are present on the surface of the earth. TEMPERATURE FRACTIONATION OF OXYGEN ISOTOPES 18O AND 16O Planktonic foraminifera live in the upper 100 meters of the ocean. In the PRESENT DAY ocean, surface seawater has a d18O near 0 (zero). And, biology fractionates this oxygen isotope ratio (organisms accumulate more of the light isotope) during metabolism. BUT the amount of this fractionation is TEMPERATE DEPENDENT. Both LAB and FIELD studies show that the temperature dependence of this BIOLOGICAL fractionation is 1 0/00 d18O decrease for each 4.2°C increase in water temperature. or… 18O becomes less abundant in the foram carbonate shells - with respect to 16O - when the temperature increases. Examples. Tropical planktonic foram shells that grow near 21°C have a d18O of about -1 0/00. (lower than the seawater value). But benthic forams living in the deep ocean (near 2°C) have a d18O value of about +5 0/00 (higher than the ambient seawater). Who has more 18O? Cold, benthic forams… and their d18O ratio will be more positive Paleoclimate scientists can use this to determine the difference between the temperature of surface seawater and the temperature of bottom water at the same site, using a single sediment core – that includes both benthic and pelagic forams. But this oxygen isotope paleo-thermometer has a major complication – the amount of ice on the continents. The formation of large ice caps changes the d18O ratio of seawater! While water passes through the Hydrological Cycle, there is continuous oxygen isotope fractionation Global Meteoric Water Line More heavy isotopes Product of dD and d18O values for precipitation from all over the world. Slope of 8 approx. equal to value of Rayleigh condensation in rain. More light isotopes How does this work? Oxygen isotopes are non-uniformly distributed over the surface of the earth. The process of evaporation, precipitation and transport of water vapor (H2O, containing oxygen of both isotopes) in the atmosphere results in a latitudinal variation in the d18O of the water in different places. Light water (water with 16O) evaporates more easily than water with a lot of 18O. This ‘light water’ evaporates near the equator and is transported toward the poles through many evaporation/ppt cycles. The 18O/16O ratio will be more negative in the snow that falls on a glacier than it is in the ocean from which the water evaporated. As the world's glaciers grow in volume, d18O values of seawater become larger (and more +, with more 16O stored in ice). The oxygen isotope ratio of seawater (or ice core water) is now recording the size of the global ice sheets. FRACTIONATION OF OXYGEN ISOTOPES DUE TO EVAPORATION, PRECIPITATION AND TRANSPORTATION. During precipitation as snow or rain, ‘heavy water’ (water with a higher 18O ratio) tends to precipitate first, leaving the residual water vapor in the atmosphere enriched in light water (water with more 16O). Each step of this evaporation/ ppt/ transport cycle decreases the d18O value of the water vapor being transported from the equator to the poles by about 10 0/00. The result is that water with the light isotope of oxygen (16O) is being transported preferentially to the poles from the equator – and there stored as ice. This leaves water with ‘excess’ 18O (high values of d18O) left as seawater. NOTE: if the temperature dependence of evaporation/precipitation were the only process working, seawater at HIGH latitudes would have very high d18O values (near +5 0/00). The fractionation between isotopes is higher at low temperatures! But the polar regions don’t. RAIN and runoff from ice/rivers produces seawater in the polar regions that has a d18O near zero, similar to the tropics. If we correct for the changes in seawater due to ice sheets, we can use the oxygen isotope ratio determined from the calcium carbonate shells of forams. Temperature dependence (from text) for the proxy d18O is T = 16.9 – 4.2 (d18Oc – d18Ow) Where T is temperature in °C, d18Oc is the d18O measured in calcite shells, and d18Ow is the d18O value of seawater when shells formed. An alternate form of the expression (see text, page 153) is Dd18Oc = Dd18Ow – 0.23 DT Where D means ‘change in’. This relationship allows paleoclimatologist to determine the temperature of the seawater at the time when the forams lived. Sediment cores provide climate records that go back several million years, at lower resolution than the ice cores. foramifera An example you have seen before. Remember: when d18O goes negative, that means that the seawater temperature is getting WARMER. Low-resolution marine stableisotope records of the PETM and the carbon isotope excursion, together with the seafloor sediment CaCO3 record. The carbon isotope (a) and oxygen isotope (b) records are based on benthic foraminiferal records and the from drill holes in the South Atlantic. Panel b shows temperatures. The decrease in sedimentary CaCO3 reflects increased dissolution and indicates a severe decrease in seawater pH (that is, ocean acidification). From Zachos et al. Nature, 2008 There are two common stable isotopes of carbon: 12C and 13C. The ratio of these isotopes is expressed in relation to a standard (PeeDeeBelemnite) as d13C = [(Rsample/Rstandard) -1] x 1000 where R = (13C/12C). As d13C values increase, the abundance of the heavier isotope (13C) increases. Biological activity fractionates in favor of 12C High 12C input 12C enriched This enrichment of 12C within the biological reservoir, depletes the 12C in the exterior seawater, and the d13C ratio of the SEAWATER becomes HIGHER. Sea water High 12C input to biology: 12C enriched Seawater becomes depleted in 12C, Sea water d13C ratio becomes HIGH and POSITIVE High 12C output to seawater as methane (d13C = -60): Sediment 12C enriched X X Seawater becomes richer in 12C and depleted in 13C, d13C ratio is LOW and NEGATIVE. And this is the broad Eocene thermal maximum Low bioproductivity This is the PETM ‘spike’ Methane spike High bioproductivity Lots of 12C stored as ‘biology’ leaving 13C behind in the seawater The Paleocene-Eocene thermal maximum (PETM) (1) sea surface temperature rose by 5°C in the tropics; (2) by more than 7°C in the Antarctic and Arctic. (3) ocean acidification was strong (CCD was shallow). (4) with the extinction of 30 to 50% of deep-sea benthic formaminiferal species. A good ‘Rule of Thumb’ is that temperature changes in the polar regions are about TWICE those of the Global Average Temperature Change. That is => 7°C temperature increase in the Antarctic means about a 3.5°C increase in global temperatures. Or about the temperature increase expected over the next 100 years due to anthropogenic greenhouse gas emissions. The initiation of the PETM is marked by an abrupt decrease in the d13C proportion of marine and terrestrial sedimentary carbon, which is consistent with the rapid addition of >1200 gigatons of 13C depleted carbon, most likely in the form of methane, into the hydrosphere and atmosphere. The broad Eocene thermal maximum lasted only 210,000 to 220,000 years, with most of the decrease in d13C occurring over a 20,000year period (the PETM) at the beginning of the event. During the Eocene, the CCD is inferred to have shoaled more than 2 km within a few thousand years. Acid Oceans? During this massive methane release, the oxidation and ocean absorption of this carbon would have lowered deep-sea pH (increased ocean acidity dramatically). This low ocean pH would have led to rapid shoaling of the calcite compensation depth (CCD), followed by a gradual recovery. Evidence of a rapid acidification of the deep oceans would be evident in the abrupt transition from carbonate-rich sediment to clay, followed by a gradual recovery to carbonate. Samples of the ocean sediment from five South Atlantic deepsea sites, all within the geologic time frame of the PETM. Graphs of the core samples show an abrupt transition from carbonate-rich sediment to clay, followed by a gradual recovery (100K years) to carbonate. Using Eocene data to simulate future climate (Zachos et al, Nature, 2008) (a), ocean surface pH (b), ocean surface calcite saturation (c) and deep-ocean temperature changes (d) in response to the input of 5,000 Gt C of anthropogenic CO2 into the atmosphere, starting from preindustrial CO2 levels. Blue and green are w/wo a silicateweathering feedback. Projected changes in deep-ocean temperature in d assume a homogeneous warming following temperature sensitivities to a doubling of CO2 concentration: short-dashed line, 4.5 °C; solid line, 3.0 °C; long-dashed line, 1.5 °C.

