Lecture outline
advertisement
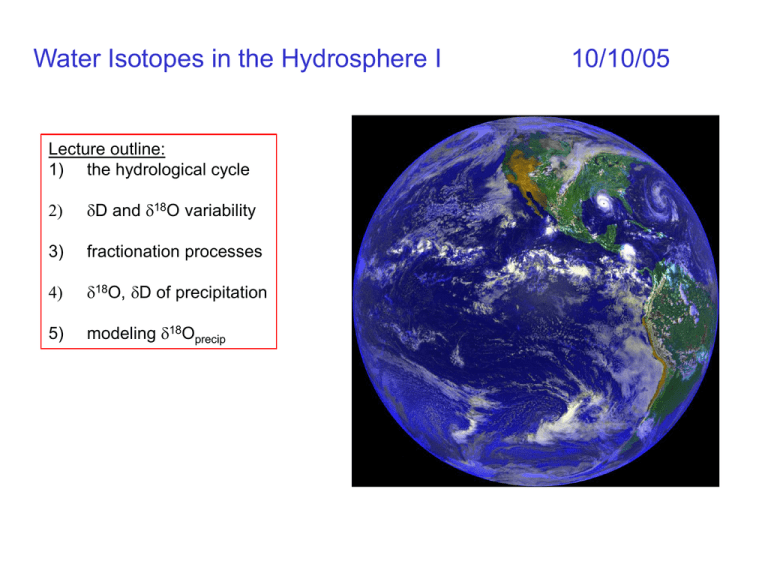
Water Isotopes in the Hydrosphere I 10/10/05 Lecture outline: 1) the hydrological cycle 2) dD and d18O variability 3) fractionation processes 4) d18O, dD of precipitation 5) modeling d18Oprecip spectrometer light intake The Hydrosphere How do 18O, 16O (d18O) and 2H, 1H (dD) move through this system? Water Isotopic Variations Ocean d18O Lake Michigan d18O = -7‰ dD = -54‰ Lake Chad d18O = -20‰ dD = -110‰ Dead Sea d18O = +4.4‰ dD = 0‰ = 0 ± 2‰ dD = 0 ± 16‰ What processes explain these variations? NOTE: water isotopes are always reported with respect to SMOW Water Isotopic Fractionation – review from last lecture Reminder: Oxygen and hydrogen isotopes are strongly fractionated as they move through the hydrological cycle, because of the large fractionation associated with evaporation/condensation. This fractionation is temperature-dependent. GNIP – global network of isotopes in precipitation Rainwater samples are routinely collected for d18O and dD analysis all over the world. The data are stored and managed by GNIP, and used to study the processes that fractionate water isotopes. Water Isotopic Fractionation – some data Rozanski, 1993 d18O of rain near SMOW in tropics, highly depleted in high-latitudes d18O of rain decreases far from vapor source (Raleigh) and is heavier during winter (temperature) Temperature effect on the d18O of precipitation holds for both spatial T variability and temporal variability Rozanski, 1993 But what if we add all the GNIP global d18Oprecip data? A bit more complicated, but generally strong relationship. However, what is happening at higher temperatures? Rozanski, 1993 The so-called “amount” effect: more rain, heavier d18O NOTE: only in tropics (<30 N and S), where “deep convection” takes place Empirical relationship – meaning….? It would be difficult to explain a vapor source at +1‰, when the tropical oceans are ~0‰. Thought to be linked to increased evaporation of raindrop in dry, under-saturated environment… (i.e. vapor is -9‰ ish, but the raindrop is enriched as it falls from the sky) Dansgaard, 1964 Rozanski, 1993 Mechanism still unknown – need atmospheric modeler’s help. Surface Water Salinity-d18O relationship - general d 18O 0.45* S 15.5 Global precipitation So d18O of surface waters, like salinity, is also correlated to evaporation – precipitation. Surface Water Salinity-d18O relationship - tropics d 18O 0.273* S 9.4 Fairbanks et al., 1997 Slope of d18O-salinity relationship is 0.273 in the deep tropics (<5 N and S), vs. 0.45 elsewhere. Why? The “Global Meteoric Water Line” – what happens to d18O happens to dD, but with a different a annual mean dD vs. d18O of precipitation But month-to-month variations at a given site fall off this line – “deuterium excess” d d D 8* d 18O d D 8* d 18O 10 Craig, 1961 Rozanski, 1993 Why don’t all waters fall on the GMWL? Or…. why do different “source” waters have different ‘deuterium excess’ values? Fact: water vapor above the ocean is -13‰ in d18O, not the -9.2‰ expected from equilibrium fractionation. Why? Planetary boundary layer -evaporation not purely equilibrium process -what other type of fractionation is involved? 1-3km the layer where exchange occurs between the surface and the free atmosphere Water Given the potential for complicated boundary layer physics, it’s a wonder that the GMWL exists at all! Deuterium excess Humid regions will show smaller departures from GMWL than arid regions. Generally interpreted as a proxy for the “source” of the moisture. Modeling water isotopes in the hydrosphere Full atmospheric General Circulation Model (GCM) with water isotope fractionation included. Noone, D., 2002 Goal: quantify physical processes associated with water isotope variability Applications: atmospheric mixing, vapor source regions, impact of climate variability on hydrological cycle, interpretation of paleoceanographic records
