****n* * !y *^ 9***PNG * *** IHDR************* ****PLTE***h**V* V
advertisement
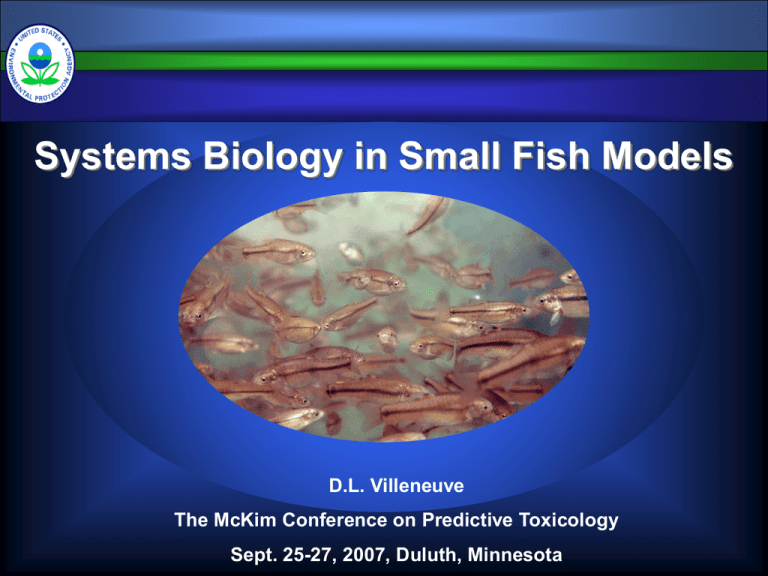
Systems Biology in Small Fish Models D.L. Villeneuve The McKim Conference on Predictive Toxicology Sept. 25-27, 2007, Duluth, Minnesota Systems Biology in Small Fish Models 1. What is systems biology or the “systems perspective”? 2. The systems perspective in ecotoxicology. 3. An overview of a systems-oriented small fish research program. 4. A case study 5. Conclusions The Systems Perspective What is a system? A subset of the world whose behavior, and whose interaction with the world, we believe can be sensibly described. • The experimenter can draw a boundary around it, heuristically • The experimenter can conduct defined perturbations within the boundaries • The experimenter can, by reasoning generate sensible explanations for the changed behavior. • Learning is assessed by how well the understanding enables prediction of changed system behavior in response to defined perturbations. Kuipers, B. 1994. MIT Press, Cambridge Brent 2004, Nature Biotech. 22: 1211-1214 The Systems Perspective Systems biology is the study of an organism, viewed as an integrated and interacting network of genes, proteins and biochemical reactions which give rise to life. www.oz.net/~geoffsi/bm2003-days/bm2003-20.htm • Systems are comprised of parts which interact. • Interaction of these parts gives rise to "emergent properties". • Emergent properties cannot be attributed to any single parts of the system. Irreducible. • To understand systems, and to be able to fully understand a system's emergent properties, systems need be studied as a whole. http://www.systemsbiology.org/Intro_to_ISB_and_Systems_Biology/Why_Systems_Matter The Systems Perspective •Non-equilibrium thermodynamics (1930s-40s) • dealt with integration quantitatively • aimed to discover general principles >> descriptive • established connection to molecular mechanisms • Investigation of biological self-organization (1950s) • examination of how structures, oscillations, and/or waves arise in a steady or homogenous environment • Feedback regulation in metabolism (late 1950s) • Systems theory in biology (1960s) • “search for general biological laws governing behavior and evolution of living matter in a way analogous to the relation of physical laws and non-living matter” • Metabolic control analysis (1970s) •Approaches to characterize properties of networks of interacting chemical reactions • Convergence with “mainstream” molecular biology – high throughput, genome-scale, “data-rich” Westerhoff and Palsson, 2004 Nature Biotech. 22:1249-1252 Wolkenhauer. 2001 Briefings in Bioinformatics. 2:258-270 The Systems Perspective • Shift from reductionism to a holistic perspective • Should reduce complexity rather than adding additional layers of complexity • Search for organizing principles over construction of predictive descriptions (models) that exactly describe the evolution of a system in space and time. • Identification of new concepts and hypotheses that provide a conceptual structure with logical coherence to rival chemistry and physics. Mesarovic et al. 2004. Syst. Biol. 1:19-27 The Systems Perspective in Ecotoxicology • Shift from reductionism to a holistic perspective • Historically, ecotoxicology and ecological risk assessment was holistic in focus • Apical/integrative endpoints: Survival, growth, reproduction • Reductionist in the sense that testing of the universe of chemicals was the paradigm. • Not feasible to test every chemical, let alone every chemical mixture • Increased emphasis on subtle, chronic impacts (e.g., development, behavior, etc.) with long-term population implications. Average Population Size Size Average Population (Proportion of Carrying Capacity) (Proportion of Carrying Capacity) Forecast Population Trajectories 1 1 A A 0% 0.8 0.8 0.6 0.6 0.4 0.4 B B 25% 0.2 0.2 E C C 50% D D 0 >95%E 75% 0 0 5 0 5 10 10 Time (Years) Time (Years) 15 15 20 20 The Systems Perspective in Ecotoxicology Search for organizing principles that underlie biological response to stressors. Develop a conceptual structure with logical coherence that allows us to predict, with reasonable and quantitative certainty, integrated, ecologically-relevant impacts. Linkage of Exposure and Effects Using Genomics, Proteomics, and Metabolomics in Small Fish Models • USEPA – Cincinnati, OH • D. Bencic, M. Kostich, I. Knoebl, D. Lattier, J. Lazorchak, G. Toth, R. Wang, • USEPA – Duluth, MN, and Grosse Isle, MI • G. Ankley, E Durhan, M Kahl, K Jensen, E Makynen, D. Martinovic, D. Miller, D. Villeneuve, • USEPA – Athens, GA • T. Collette, D. Ekman, J. Kenneke, T. Whitehead, Q. Teng • USEPA-RTP, NC • M. Breen, R. Conolly • USEPA STAR Program • N. Denslow (Univ. of Florida), E. Orlando, (Florida Atlantic University), K. Watanabe (Oregon Health Sciences Univ.), M. Sepulveda (Purdue Univ.) • USACE – Vicksburg, MS • E. Perkins • Other partners • Joint Genome Institute, DOE (Walnut Creek, CA) • Sandia, DOE (Albuquerque, NM) • Pacific Northwest National Laboratory (Richland, WA) • C. Tyler (Univ. Exeter, UK) Compartment GABA Dopamine Brain ? ? ? PACAP Pituitary GnRH Neuronal System GnR H D2 R Y2 R GnRH R 2 Muscimol* (+) 3 Apomorphine (+) 4 Haloperidol (-) Y1 R Gonadotroph D2 R GPa FSHb Blood NPY GAB AB R Activin R Fipronil* (-) Y2 R GAB AA R PAC1 R 1 D1 R Follistatin Activi n Chemical “Probes” Circulating LDL, HDL LHb Circulating LH, FSH LDL R LH R FSH R 5 Trilostane (-) 6 Ketoconazole (-) HDL R Cholestero l Outer mitochondrial membrane StAR Inner mitochondrial membrane Gonad (Generalized, gonadal, steroidogenic cell) Activi n Inhibi n P450scc pregnenolone 3bHSD 17α-hydroxyprogesterone P450c1 7 20βHS D 7 Fadrozole (-) 8 Prochloraz (-,-) progesterone androstenedion e 17βHSD 17α,20β-P (MIS) testosterone P450arom P45011β. 9 11βHSD 11-ketotestosterone Blood estradio l 10 Circulating Sex Steroids / Steroid Hormone Binding Globlulin 11 Androgen / Estrogen Responsive Tissues (e.g. liver, fatpad, gonads) ER AR 12 Vinclozolin (-) Flutamide (-) β-trebolone (+) Ethynyl estradiol (+) Figure 1. Conceptual Overview of Research Increasing Diagnostic (Screening) Utility Increasing Ecological Relevance Levels of Biological Organization Molecular Cellular Organ Individual Population mRNA, protein, Enzyme assays Metabolite profiles Functional and Structural change (Pathology) Altered reproduction Decreased numbers or development of animals Well characterized genome, Phase 2. low eco / regulatory relevance Zebrafish genomics proteomics, metabalomics Computational modeling Systems modeling Poorly characterized genome Phase 3. Phase 1. Fathead minnow molecular markers metabolomics Fathead minnow 21 d reproduction test high eco / regulatory relevance →’s Depict the flow of information Population modeling A Case Study with Fadrozole N N N N CN CN Aromatase 7 Ovary A B 6 *C* 4 IC50 = 6.93 +/- 0.80 μM *D* 3 *E* 2 1 0 0.1 1 10 100 fadrozole (uM) 5000 Brain A 4500 *B* 4000 3500 fmol/h/mg fmol/h/mg 5 3000 *C* 2500 2000 IC50=8.82 +/- 1.58 μM *D* 1500 1000 *E* 500 *F* 0 0.01 0.1 1 10 fadrozole (uM) 100 1000 N A Case Study with Fadrozole N CN Cholesterol CYP11A CYP17 (hydroxylase) Pregnenolone CYP17 (lyase) 17a-OH-Pregnenolone 3b-HSD Progesterone DHEA 3b-HSD 3b-HSD CYP17 (hydroxylase) CYP21 17a-OH-Progesterone CYP21 CYP17 (lyase) 20b-HSD CYP19 Androstenedione 17b-HSD estrone 17b-HSD CYP19 11-deoxycorticosterone CYP11B1 Testosterone 11-deoxycortisol corticosterone CYP11B2 CYP11B2 17α20β-dihydroxy-4pregnen-3-one CYP11B1 11β-OHTestosterone 11βHSD aldosterone cortisol 11-Ketotestosterone 17b-estradiol Androstenedione 17b-HSD N estrone 17b-HSD CYP19 Testosterone 17b-estradiol 24 h-E2 CN 25oC, Ex vivo E2 production (ng/ml*12 h) 0.4 12 h A 0.35 0.3 B 0.25 0.2 C 0.15 0.1 0.05 0 0 RIA Ex vivo T production (ng/ml*12 h) N CYP19 0.18 0.16 0.14 0.12 0.1 0.08 0.06 0.04 0.02 0 24 h-T 3 30 Fadrozole (ug/L) B AB A 0 3 30 VTG (mg/ml) Fadrozole, Female Vtg 18 16 14 12 10 8 6 4 2 0 a Female 24 h b b z 0 6 Fadrozole (ug/L-nominal) 60 Brain sGnRH neurons cGnRH neurons dopaminergic neurons sGnRH release cGnRH release dopamine release GnRH FSH gonadotrophs LH gonadotrophs FSH LH Blood supply Blood supply Pituitary Testis Ovaries Leydig cells steroids Liver Sertoli cells Spermatocytes Sperm mat. Steroid metab. Theca cells Granulosa cells steroids vitellogenesis Oocytes oocyte mat. Figure Key state transition Gonadotropin expression Steroid metabolismand secretion transcriptional activatio translational activation transcription inhibition dissociation association genes GnRH release mRNA protein activated protein receptor Vitellogenesis and Oocyte maturation Steroidogenesis Cholesterol transport pheno type Figure Key state transition transcriptional activatio translational activation transcription inhibition dissociation association genes mRNA protein activated protein receptor pheno type N N Inner mitochondrial membrane CN Fadrozole exposure Ex vivo E2 production (relative to control) 10 post-exposure 0 3 30 # # * 1 * * * # # # 0.1 24 h 48 h 4d 9d Time point exposure 10 8d 10 d 12 d 16 d post-exposure # Evidence for compensatory/feedback response to fadrozole. Ex vivo T production (relative to control) # # # # # * # 1 0 3 30 24 h 48 h 4d 0.1 8d 9d Time point 10 d 12 d 16 d Aromatase A (CYP19A) gene expression exposure 18000 post-exposure CYP19A mRNA (copies/ng total RNA) 16000 c 14000 12000 10000 0 8000 3 30 b 6000 4000 2000 b b a a b a a a a b b a ab b a a 0 1 4 8 9 Time point (d) 12 16 Pituitary LHβ LHR Cholesterol FSHβ StAR Inner mitochondrial membrane Cyt b5 Cholesterol CYP11A Pregnenolone CYP17 (hydroxylase) CYP17 (lyase) 17a-OH-Pregnenolone 3b-HSD Progesterone FSHR G-protein mediated Signal transduction DHEA 3b-HSD 3b-HSD CYP17 (hydroxylase) 17a-OH-Progesterone CYP17 (lyase) 20b-HSD CYP19 Androstenedione 17b-HSD 17b-HSD CYP19 Testosterone 17α20β-dihydroxy-4pregnen-3-one CYP11B1 11β-OHTestosterone 11βHSD Fig. 1 estrone 11-Ketotestosterone 17b-estradiol P450scc (CYP11A) gene expression exposure P450scc mRNA (transcript abundance relative to controls) 2.5 2 post-exposure b b 1.5 a a ab a b ab a a 1 b a a a a a ab 3 a 0.5 0 1 4 8 9 Time point (d) 12 0 16 30 FSHR gene expression exposure 450 post-exposure 0 3 30 400 FSHR mRNA (copies/ng total RNA) c 350 b 300 a b 200 150 c b 250 a b b a a a a a 100 b ab a a 50 0 1 4 8 9 Exposure duration (d) 12 16 Despite evidence for compensation at the molecular and biochemical level, 21 d exposure to fadrozole causes adverse apical effect on reproduction. 6 10 4 8 Fadrozole (ug/L) * 2 * Vtg (mg/ml) 0 20 Cumulative Number of Eggs (Thousands) E2 (ng/ml) 8 Control 2 10 6 50 * * * 4 2 10 0 * -20 -18 -16 -14 -12 -10 -8 -6 -4 -2 0 * 0 Control 2 10 2 4 Exposure (d) * 50 Fadrozole (µg/l) • Under what conditions would compensation be successful? • Under what conditions does it fail to prevent adverse effect? • Under what conditions does it contribute to or exacerbate the initial impact of the stressor? 6 8 10 12 14 16 18 20 A Case Study with Fadrozole • Supervised – low content analyses • Unsupervised – high content analyses High-content analyses N N Fadrozole Gonads CN Brain Liver High desnity oligonucleotide microarrays Enriched Gene Ontology Categories Brain Cholesterol biosynthesis Cholesterol transport Bile acid synthesis Cytoskeletal components Oxidative phosphorylation Coagulation/wound response Immune response Ion transport Cell adhesion Reproduction Nucleotide biosynthesis Liver Ribosomal proteins Ribosomal RNAs Translation Oocytes/oogenesis Iron transport/plasma proteins Immune response and inflammation Cytoskeletal components Ovary Ribosomal proteins Ribosomal RNAs Extracellular matrix Connective tissue Coagulation/wound response Cytoskeletal components Oxidative phosphorylation Ion transport Embryonic development Cell adhesion Oogenesis Reverse engineering gene regulatory architecture Different reverse engineering algorithms. Dynamic Bayesian Network (Yu et al 2004, Zhao et al 2006 ) Boolean (Hashimoto et al 2004) Information theory (Margolin et al 2006) Network Approach • • • • Start with complex system Determine players and links in network Calculate network statistics Use network statistics to make predictions about network function Robustness and fragility in ecosystems and gene networks is related to network architecture (sensitivity or insensitivity to network perturbation) In general, more interactions = more plasticity Biological systems – generally many nodes with relatively few links, and relatively few nodes with many links (critical regulatory nodes) Csete & Doyle 2004 Trends in Biotechnol. 22:446-450 Zhao et al. 2006. BMC Bioinformatics 7:386 Csete & Doyle 2002. Science. 295:1664-1669 CONCLUSIONS • Consideration of interactions and relationships is at the heart of the systems perspective. Systems models serve as a critical translator between initiating events (modeled by QSAR) and biological outcome. • Systems models need not be infinitely detailed. Resolution required defined by the questions to be answered. • Toxicity pathways linking exposure to adverse effect include the direct effect of the chemical and a wide variety of indirect secondary, tertiary….and potentially stochastic effects that influence the apical outcome. • Molecular and biochemical responses to stressors are both dose and time-dependent, and best represented in three dimensions. Important consideration for biomarker-based bioassay and high-throughput screening. CONCLUSIONS • Modern “omics” tools facilitate unprecedented scale and detail in the descriptive analysis of biological systems. The greater challenge is in defining relationships and the general principles that govern them. •Overall architecture of the systems or networks can reveal important attributes related to function. •Hypothesis driven and unsupervised analysis of biological systems or networks can reveal critical regulatory nodes that integrate signals and drive component function or phenotype. • The ultimate goal of systems ecotoxicology is discovery of generalized or universal principles that govern biological responses to stressors.
