View/Open - Oregon State University
advertisement
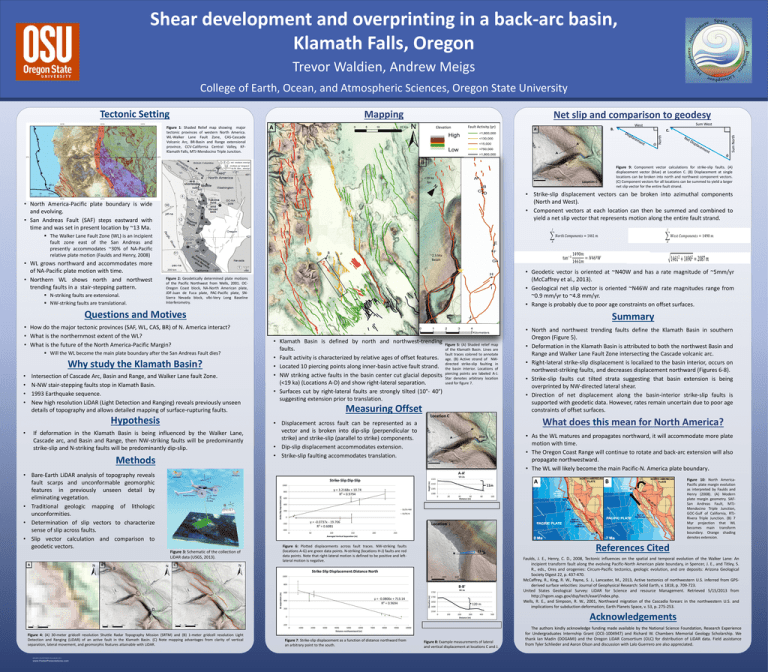
Shear development and overprinting in a back-arc basin, Klamath Falls, Oregon Trevor Waldien, Andrew Meigs College of Earth, Ocean, and Atmospheric Sciences, Oregon State University Mapping A Fault Activity (yr) Elevation B. A φ <19 ka fan Figure 9: Component vector calculations for strike-slip faults. (A) displacement vector (blue) at Location C. (B) Displacement at single locations can be broken into north and northwest component vectors. (C) Component vectors for all locations can be summed to yield a larger net slip vector for the entire fault strand. Location C • Strike-slip displacement vectors can be broken into azimuthal components (North and West). • Component vectors at each location can then be summed and combined to yield a net slip vector that represents motion along the entire fault strand. • North America-Pacific plate boundary is wide and evolving. • San Andreas Fault (SAF) steps eastward with time and was set in present location by ~13 Ma. AA The Walker Lane Fault Zone (WL) is an incipient fault zone east of the San Andreas and presently accommodates ~30% of NA-Pacific relative plate motion (Faulds and Henry, 2008) N-striking faults are extensional. NW-striking faults are translational. B ~2.3 Ma Basalt • Geodetic vector is oriented at ~N40W and has a rate magnitude of ~5mm/yr (McCaffrey et al., 2013). • Geological net slip vector is oriented ~N46W and rate magnitudes range from ~0.9 mm/yr to ~4.8 mm/yr. • Range is probably due to poor age constraints on offset surfaces. Figure 2: Geodetically determined plate motions of the Pacific Northwest from Wells, 2001. OCOregon Coast block, NA-North American plate, JDF-Juan de Fuca plate, PAC-Pacific plate, SNSierra Nevada block, vlbi-Very Long Baseline Interferometry. Questions and Motives • How do the major tectonic provinces (SAF, WL, CAS, BR) of N. America interact? • What is the northernmost extent of the WL? • What is the future of the North America-Pacific Margin? Will the WL become the main plate boundary after the San Andreas Fault dies? Why study the Klamath Basin? Intersection of Cascade Arc, Basin and Range, and Walker Lane fault Zone. N-NW stair-stepping faults stop in Klamath Basin. 1993 Earthquake sequence. New high resolution LiDAR (Light Detection and Ranging) reveals previously unseen details of topography and allows detailed mapping of surface-rupturing faults. Hypothesis • If deformation in the Klamath Basin is being influenced by the Walker Lane, Cascade arc, and Basin and Range, then NW-striking faults will be predominantly strike-slip and N-striking faults will be predominantly dip-slip. Methods • Bare-Earth LiDAR analysis of topography reveals fault scarps and unconformable geomorphic features in previously unseen detail by eliminating vegetation. • Traditional geologic mapping of lithologic unconformities. • Determination of slip vectors to characterize sense of slip across faults. • Slip vector calculation and comparison to geodetic vectors. Summary • Klamath Basin is defined by north and northwest-trending faults. • Fault activity is characterized by relative ages of offset features. • Located 10 piercing points along inner-basin active fault strand. • NW striking active faults in the basin center cut glacial deposits (<19 ka) (Locations A-D) and show right-lateral separation. • Surfaces cut by right-lateral faults are strongly tilted (10°- 40°) suggesting extension prior to translation. Measuring Offset B What does this mean for North America? • Displacement across fault can be represented as a vector and is broken into dip-slip (perpendicular to strike) and strike-slip (parallel to strike) components. • Dip-slip displacement accommodates extension. • Strike-slip faulting accommodates translation. • As the WL matures and propagates northward, it will accommodate more plate motion with time. • The Oregon Coast Range will continue to rotate and back-arc extension will also propagate northwestward. • The WL will likely become the main Pacific-N. America plate boundary. 37m A-A’ 1000 y = 3.2168x + 10.74 R² = 0.9794 Strike Slip Separation (m) 800 VE=2x 1315 Strike-Slip:Dip-Slip 1310 11m B 1300 0 20 40 60 Distance (m) 80 100 400 SS/DS-NW 200 SS/DS-N 0 y = -0.0737x - 19.706 R² = 0.6081 Location J -400 0 50 100 150 200 250 Averaged Vertical Separation (m) Figure 6: Plotted displacements across fault traces. NW-striking faults (locations A-G) are green data points. N-striking (locations H-J) faults are red data points. Note that right-lateral motion is defined to be positive and leftlateral motion is negative. Faulds, J. E., Henry, C. D., 2008, Tectonic influences on the spatial and temporal evolution of the Walker Lane: An incipient transform fault along the evolving Pacific-North American plate boundary, in Spencer, J. E., and Titley, S. R., eds., Ores and orogenies: Circum-Pacific tectonics, geologic evolution, and ore deposits: Arizona Geological Society Digest 22, p. 437-470. McCaffrey, R., King, R. W., Payne, S. J., Lancaster, M., 2013, Active tectonics of northwestern U.S. inferred from GPSderived surface velocities: Journal of Geophysical Research: Solid Earth, v. 1818, p. 709-723. United States Geological Survey: LiDAR for Science and resource Management. Retrieved 5/15/2013 from http://ngom.usgs.gov/dsp/tech/eaarl/index.php. Wells, R. E., and Simpson, R. W., 2001, Northward migration of the Cascadia forearc in the northwestern U.S. and implications for subduction deformation; Earth Planets Space, v. 53, p. 275-253. Strike-Slip Displacement:Distance North 1000 D B-B' VE-1x 1750 600 Elevation (m) C SS separation (m) 800 y = -0.0806x + 713.14 R² = 0.9694 400 200 1700 1650 120 m 1600 1550 0 0 100 200 300 400 Figure 10: North AmericaPacific plate margin evolution as interpreted by Faulds and Henry (2008). (A) Modern plate margin geometry. SAFSan Andreas Fault, MTJMendocino Triple Junction, GOC-Gulf of California, RTJRivera Triple Junction. (B) 7 Myr projection that WL becomes main transform boundary. Orange shading denotes extension. References Cited 33 m C B A 1305 600 -200 Figure 3: Schematic of the collection of LiDAR data (USGS, 2013). A Figure 5: (A) Shaded relief map of the Klamath Basin. Lines are fault traces colored to annotate age. (B) Active strand of NWdirected strike-slip faulting in the basin interior. Locations of piercing points are labeled A-J. Star denotes arbitrary location used for figure 7. • North and northwest trending faults define the Klamath Basin in southern Oregon (Figure 5). • Deformation in the Klamath Basin is attributed to both the northwest Basin and Range and Walker Lane Fault Zone intersecting the Cascade volcanic arc. • Right-lateral strike-slip displacement is localized to the basin interior, occurs on northwest-striking faults, and decreases displacement northward (Figures 6-8). • Strike-slip faults cut tilted strata suggesting that basin extension is being overprinted by NW-directed lateral shear. • Direction of net displacement along the basin-interior strike-slip faults is supported with geodetic data. However, rates remain uncertain due to poor age constraints of offset surfaces. Location C Height (m) • • • • C. Θ B • WL grows northward and accommodates more of NA-Pacific plate motion with time. • Northern WL shows north and northwest trending faults in a stair-stepping pattern. Sum West West Sum North Figure 1: Shaded Relief map showing major tectonic provinces of western North America. WL-Walker Lane Fault Zone, CAS-Cascade Volcanic Arc, BR-Basin and Range extensional province, CCV-California Central Valley, KFKlamath Falls, MTJ-Mendocino Triple Junction. Net slip and comparison to geodesy North Tectonic Setting 500 Distance (m) Acknowledgements -200 0 1000 2000 3000 4000 5000 6000 7000 8000 9000 10000 Distance northwestward (m) Figure 4: (A) 30-meter gridcell resolution Shuttle Radar Topography Mission (SRTM) and (B) 1-meter gridcell resolution Light Detection and Ranging (LiDAR) of an active fault in the Klamath Basin. (C) Note mapping advantages from clarity of vertical separation, lateral movement, and geomorphic features attainable with LiDAR. RESEARCH POSTER PRESENTATION DESIGN © 2012 www.PosterPresentations.com Figure 7: Strike-slip displacement as a function of distance northward from an arbitrary point to the south. Figure 8: Example measurements of lateral and vertical displacement at locations C and J. The authors kindly acknowledge funding made available by the National Science Foundation, Research Experience for Undergraduates Internship Grant (OCE-1004947) and Richard W. Chambers Memorial Geology Scholarship. We thank Ian Madin (DOGAMI) and the Oregon LiDAR Consortium (OLC) for distribution of LiDAR data. Field assistance from Tyler Schlieder and Aaron Olson and discussion with Lalo Guerrero are also appreciated.

