Types of models
advertisement
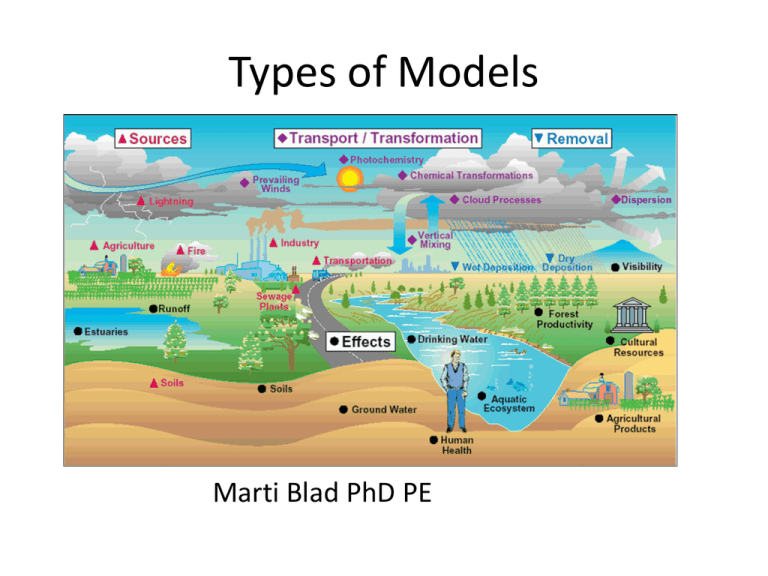
Types of Models Marti Blad PhD PE EPA Definitions • Dispersion Models: Estimate pollutants at ground level receptors • Photochemical Models: Estimate regional air quality, predicts chemical reactions • Receptor Models: Estimate contribution of multiple sources to receptor location based on multiple measurements at receptor • Screening Models: applied 1st , determines if further modeling needed • Refined Models: req’d for SIP, NSR, and PSD – Regulatory requirement for permits Models = Representations or pictures • Numerical algorithms – Sets of equations need inputs – Describe = quantify movement – Simplified representation of complex system – Box or Mass Balance • Used to study & understand the complex – Physical, chemical, and spatial, interactions Types of Models • Gaussian Plume – Analytical approximation of dispersion – more later • Statistical & Stochastic – Based on probability – Recall regression is linear model • Empirical – Based on experimental or field data – Actual numbers • Physical (scale models) – Flow visualization in wind tunnels, etc. Recall bell shaped curve • Plume dispersion in lateral & horizontal planes characterized by a Gaussian distribution • Normal Distribution – Mu is median – Sigma is spread Gaussian-Based Dispersion Models • Pollutant concentrations are calculated estimations at receptor • Uncertainty of input data values – Data quality, completeness • Steady state assumption – No change in source emissions over time • Screen3 will be end of the week Gaussian Dispersion z Dh = plume rise h = stack height Dh H = effective stack height H = h + Dh H h x C(x,y,z) Downwind at (x,y,z) ? y Air Pollution Dispersion (cont.) • This assumption allows us to calculate concentrations downwind of source using this equation where c(x,y,z) = contaminant concentration at the specified coordinate [ML3], x = downwind distance [L], y = crosswind distance [L], z = vertical distance above ground [L], Q = contaminant emission rate [MT-1], sy = lateral dispersion coefficient function [L], sz = vertical dispersion coefficient function [L], u = wind velocity in downwind direction [L T-1], H = effective stack height [L]. Gaussian model picture • Predicted concentration map The Gaussian Plume Model • The shape of the curve = Bell shaped = Gaussian curve hence the model is called by that name. 11 Ways to think about math • Gaussian = “normal” curve math – Recall previous distribution picture – Dispersion & diffusion dominates • Eulerian – Assumes uniform concentrations in box – Assumes rapid vertical and horizontal mixing – Plume in a grid – Predicts species concentrations – Multi day scenarios Eulerian Air Quality Models Figure from http://irina.colorado.edu/lectures/Lec29.htm AKA Plume in Grid Box idea: 1-D and 2-D Models Dimensional Concept Variable is Time: t Variable is Time and height: t, y Variable is Time, height and length distance: t, x, y t, x, y, z 3-Dimensional Models Depth of boxes discussed under meteorology Other choice: Lagrangian • “Puffs” of pollutants • Trajectory models • Follow the particle Puff W2 W1 S.S. Plume Lagrangian Air Quality Models From “INTERNATIONAL AIR QUALITY ADVISORY BOARD 1997-1999 PRIORITIES REPORT, the HYSPLIT Model” (http://www.ijc.org/boards/iaqab/pr9799/project.html) Assumptions & limitations • Physical conditions: Topography – Locations: buildings, source, community, receptor – Appropriate for the averaging time period • Statistics & math • Meteorology • Stack or source emission data – Pollutant emission data – Plume rise, Stack or source specific data – Location of source and receptors EPA MODELS—Screening CTSCREEN COMPLEX1 LONGZ RTDM32 SCREEN3 RVD2 CTSCREEN VISCREEN TSCREEN SHORTZ VALLEY EPA MODELS—Regulatory MPTER ISC3 OCD CALPUFF EKMA CRSTER UAM CALINE3 AERMOD CDM2 CAL3QHC RAM CTDMPLUS BLP EPA Models—Other MESOPUFF TOXST COMPDEP FDM CMB7 PLUVUE2 RPM-IV SDM MOBILE5 DEGADIS
