Choice Board Scoring Guide
advertisement
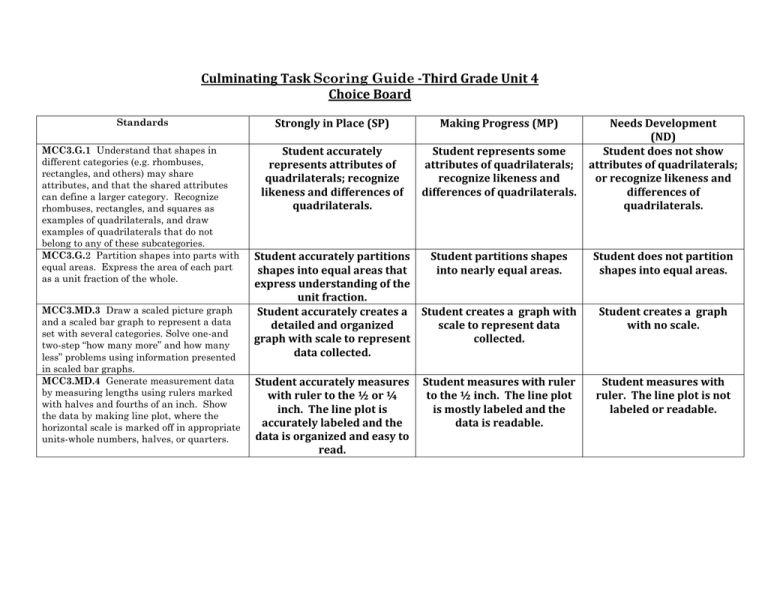
Culminating Task Scoring Guide -Third Grade Unit 4 Choice Board Standards Strongly in Place (SP) Making Progress (MP) MCC3.G.1 Understand that shapes in different categories (e.g. rhombuses, rectangles, and others) may share attributes, and that the shared attributes can define a larger category. Recognize rhombuses, rectangles, and squares as examples of quadrilaterals, and draw examples of quadrilaterals that do not belong to any of these subcategories. MCC3.G.2 Partition shapes into parts with equal areas. Express the area of each part as a unit fraction of the whole. Student accurately represents attributes of quadrilaterals; recognize likeness and differences of quadrilaterals. Student represents some attributes of quadrilaterals; recognize likeness and differences of quadrilaterals. MCC3.MD.3 Draw a scaled picture graph and a scaled bar graph to represent a data set with several categories. Solve one-and two-step “how many more” and how many less” problems using information presented in scaled bar graphs. MCC3.MD.4 Generate measurement data by measuring lengths using rulers marked with halves and fourths of an inch. Show the data by making line plot, where the horizontal scale is marked off in appropriate units-whole numbers, halves, or quarters. Needs Development (ND) Student does not show attributes of quadrilaterals; or recognize likeness and differences of quadrilaterals. Student accurately partitions Student partitions shapes shapes into equal areas that into nearly equal areas. express understanding of the unit fraction. Student accurately creates a Student creates a graph with detailed and organized scale to represent data graph with scale to represent collected. data collected. Student does not partition shapes into equal areas. Student accurately measures with ruler to the ½ or ¼ inch. The line plot is accurately labeled and the data is organized and easy to read. Student measures with ruler. The line plot is not labeled or readable. Student measures with ruler to the ½ inch. The line plot is mostly labeled and the data is readable. Student creates a graph with no scale. SMP Strongly in Place Satisfactory Making Progress/ Developing Area of Concern Make sense of problems and persevere in solving them. The student explained the problem and showed perseverance by identifying the purpose of the problem and selected and applied an appropriate problem solving strategy that lead to a thorough and accurate solution. The student explained the problem and showed perseverance when identifying the purpose of the problem, and selected an applied and appropriate problem solving strategy that lead to a generally complete and accurate solution. The student explained the problem and showed some perseverance in identifying the purpose of the problem, and selected and applied an appropriate problem solving strategy that lead to a partially complete and/or partially accurate solution. The student was unable to explain the problem and showed minimal perseverance when identifying the purpose of the problem. Attends to precision The student was precise by clearly describing their actions and strategies, while showing understanding and using above-grade-level appropriate vocabulary in their process of finding solutions. The student was precise by clearly describing their actions and strategies, while showing understanding and using grade-level appropriate vocabulary in their process of finding solutions. The student was precise by clearly describing their actions and strategies, while showing understanding and using appropriate vocabulary in their process of finding solutions. The student was unclear in their thinking and was unable to communicate mathematically. Reasoning and Explaining The student expressed and justified their opinion both quantitatively and abstractly using a variety of numbers, pictures, charts and words. The student expressed and justified their opinion both quantitatively and abstractly using numbers, pictures, charts and/or words. The student expressed or justified their opinion either quantitatively OR abstractly using numbers, pictures, charts OR words. The student was unable to express or justify their opinion quantitatively or abstractly using numbers, pictures, charts or words. Models and use of tools The student selected multiple efficient tools and correctly represented the tools to reason and justify their response. In addition this students was able to explain why their tool/ model was efficient The student selected an efficient tool and/or drew a correct representation of the efficient tool used to reason and justify their response. The student selected appropriate tools or drew a correct representation of the tools used to reason and justify their response. The student was unable to select an appropriate tool, draw a representation to reason or justify their thinking. Seeing structure and generalizing The student identified various patterns and structures in the number system and noticed connections to multiple areas of mathematics and real-life. The student identified patterns or structures in the number system and noticed connections to other areas of mathematics and real-life. The student identified a pattern or structure in the number system and noticed connections to other areas of mathematics or reallife. The student was unable to identify patterns, structures or connect to other areas of mathematics and/or real-life.
