rats
advertisement
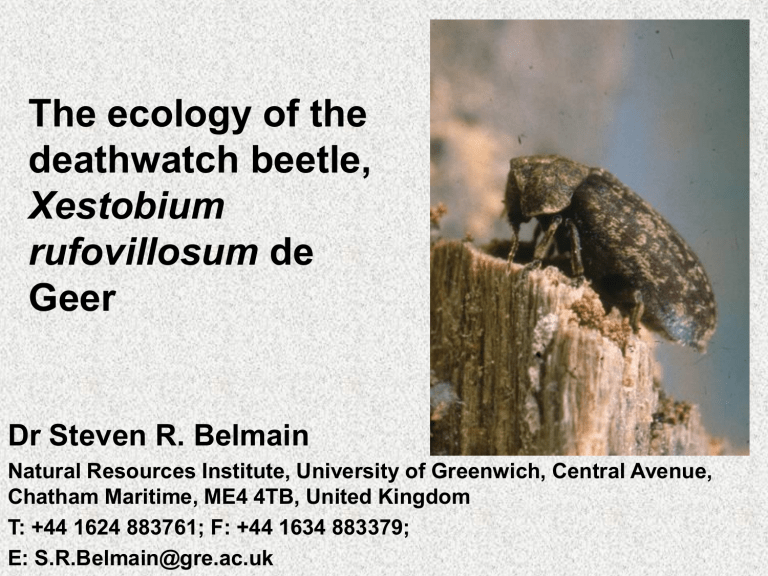
The ecology of the
deathwatch beetle,
Xestobium
rufovillosum de
Geer
Dr Steven R. Belmain
Natural Resources Institute, University of Greenwich, Central Avenue,
Chatham Maritime, ME4 4TB, United Kingdom
T: +44 1624 883761; F: +44 1634 883379;
E: S.R.Belmain@gre.ac.uk
Socio-economic tools for rodent
management research: Recent
experience from Africa and Asia
Dr Steven R. Belmain and colleagues
Natural Resources Institute, University of Greenwich,
Central Avenue, Chatham Maritime, ME4 4TB, United
Kingdom
T: +44 1624 883761; F: +44 1634 883379;
E: S.R.Belmain@gre.ac.uk
The black box of social science
Philosophy
Mathematical proof
Deductive reasoning
Statistics
Empiricism
Increasing complexity
Physics Chemistry Biology Economics Sociology Political Science
Psychology
Geography
Archaeology
Sociobiology
History
Linguistics
Biological Anthropology
Rodent Management will not work unless the
Managers adequately understand the problem
and its solutions in sufficient detail.
Tools and knowledge need to be appropriate
Rodent Managers
Qualified personnel – service providers
Pest Control Operators
Environmental Health Officers
Agriculture Extensionists
Everyone else – rural / urban settlements
Farmers
Households
Communities
Understanding the Manager
Tools that we can use to
understand the Rodent Manager
Knowledge, Attitude and Practice Survey
Community meetings
Tools that we can use to
understand the Rodent Manager
Knowledge, Attitude and Practice Survey
Community meetings
Resource mapping / survey
Tools that we can use to
understand the Rodent Manager
Knowledge, Attitude and Practice Survey
Community meetings
Resource mapping / survey
Individual meetings / questionnaires
Tools that we can use to
understand the Rodent Manager
Knowledge, Attitude and Practice Survey
Community meetings
Resource mapping / survey
Individual meetings / questionnaires
Observation
Tools that we can use to
understand the Rodent Manager
Knowledge, Attitude and Practice Survey
Community meetings
Resource mapping / survey
Individual meetings / questionnaires
Observation
It’s all about asking the right
questions and interpreting
the answers
Designing your survey
Culture
Gender
Education
Language
Consultation
Pre-testing
Experience
Actions (what)
Timing (when)
Where
1. Synchrony of cropping
2. Irrigation channel <30 cm
3. Sanitation – keep grass
growth low; clean around
villages and rice stores
4. Kill traps; Live traps; pitfall
traps (gourds, etc) †
5. Digging/flooding burrows †
Planting/harvest
All year
All year
Fields
Fields
Fields &
Houses
1 week after
transplanting
1 week after
transplanting
1 week after
transplanting
Tillering and harvest
All year
6. Beating †
7. Clean cultivation and
harvest; manage straw stacks
8. Promote predators
9. Lanirat (Bromadiolone)
10. Zinc Phosphide
11. Line TBS
12. CTBS
13. Fumigate - Aluminium
Phosphide Burning chilli
14. Smoking – chilli or
tobacco
15. Predator symbol –
banana tree like man; palm
frond like cobra
In upland habitats,
edges of roads, etc.,
after land preparation
(All crop stages)
As above
(All crop stages)
Tillering and around
harvest
Select crop
When rat numbers high
Dry season
All year
Individual or
community
(Who)
Community
Community
Individual
Ecologicallybased rodent
management
Priority
Houses
Community
High
Fields
Community
High
Fields &
Houses
Fields
Community
High
Individual
High
Fields &
Houses
Fields
Community
High
Individual
Medium
Houses (use
kill traps
instead)
Fields
Individual
Medium
Houses (use
kill traps
instead)
Fields
Community
Test
Fields
Houses
Community
Individual
Test
Low
Fields &
Houses
Fields
Individual
Individual
V High
V High
V High
Low
Low
Crop calendar
Province/Crop
Nov
Jakunipara - Comilla
BORO Rice
Dec
Jan
Feb
Seedbed 40
day
Transplant
Mar
Apr
May
Jun
Jul
Sep
Oct
Seed
Transplant
Seed
Harvest
Transplant
Sowara - Comilla
Rice as above
Potato
Brassicas
Fallow
Harvest Nov/Dec
Sowing
Nasir Gram – Feni
BORO Rice
Nov
Harvest
AUS Rice
T. AMAN Rice
Vegetables
Fallow
T. AMAN Rice
AUS Rice
Aug
Seedbed 40
Transplant
day
2-3 months fallow because of floods
Harvest
Harvest
Seed
*Seedbed 45d
Transp
Harv. Dec
none
Vegetables – near houses
Vegetables
Potatoes - staggered
Province/Crop
Nov
Dec
Jan
Feb
Mar
Apr
May
Jun
Jul
Aug
Sep
Oct
Nov
Actions
(what)
Timing
(when)
Where
1. Lanirat
(Bromadiolone)
When rat
numbers
high
As needed
All year
Fields +
houses
2. Kill traps
3. Sanitation
4. Live traps; pitfall
traps (gourds, etc)
5.Digging/flooding
burrows
6. Cats as predators
7. Zinc Phosphide
8. Burning chilli to
fumigate
All year
When rat
numbers
high
All year
Dry season
rat numbers
high
When rat
numbers
high
Who
(Individual or
community)
Individual
Cost
Effective
Environ
Friendly
Priority
300-500
taka/yr
Yes
No
High
Houses
Houses
+ Fields
Houses
+ Fields
Fields
Individual
Individual
Cheap
Nothing
Yes
Yes
Yes
Yes
Individual
Cheap
Yes
Yes
Individual
Nothing
Yes
Yes
Houses
Fields
Individual
Individual
Nothing
Yes
Yes
No
Yes
??
Houses
Individual
Cheap
Yes
No
Housewife
35%
Other
20%
Petty trade
3%
Illiterate
28%
Farmer
42%
Primary
22%
Adult Education
2%
Madrasa (Religious
school)
8%
Graduate
3%
Higher Secondary
3%
Secondary
34%
Amount of cultivable land (decimals)
1-49
50-99
100-149
150-199
200 and above
Landless
Poison safety
Safe
Not safe
Maybe
Non-response
% of total response
20
13.3
20
1.6
15
30
% of total response
13.8
82.8
3.4
0
Rodent effect on human health
Health problems
No health problems
Maybe
Do not know
Non-response
% of total response
55.9
23.7
5.1
15.3
0
Synthesising the data
Decision trees, Flow charts, Matrices, Problemcause diagrams, Bayesian belief networks
Taken from: Aplin, K.A., Brown, P.R., Jacob, J., Krebs, C.J. and Grant R. Singleton (2003). Field methods
for rodent studies in Asia and the Indo-Pacific. ACIAR Monograph 100; ACIAR, Canberra, AU. 223 pp.
Are there generalisations we can make
about Rodent Managers?
•
•
•
•
•
•
•
People like to see dead bodies
Poison should act fast
Underestimation of the damage caused
Limited microbiological knowledge
Anthropomorphism
“Trap shy dogma”
The technology gap
Just a bunch of surveys?
Participation of the Rodent Managers in
their own KAP assessment
Farmer Diaries
• Five farmers in a group
• Male and female groups
• Six groups in a village
• Four villages
• Group leaders to
manage
• Meeting once a week
• NGO staff to oversee
process
Farmer Diaries
Recording information on time and money
spent related to rodent damage, repairs and
rodent management activities
Item
House wall
Input
Cost (taka)
Repairing time (minutes)
House floor Cost (taka)
Repairing time (minutes)
Rice store
Cost (taka)
Repairing time (minutes)
Basket
Cost (taka)
Repairing time (minutes)
Furniture
Cost (taka)
Repairing time (minutes)
Clothes
Cost (taka)
Repairing time (minutes)
Jakunipara
n=73
54.5
622.8
24.0
518.2
35.5
100.3
21.9
29.1
66.3
35.0
113.5
48.4
Sowara
n=45
5.7
203.4
4.0
215.1
19.2
34.5
22.2
19.0
39.8
27.1
116.8
28.0
No intervention
{
{
Intervention
Anandapur
n=48
18.5
419.2
16.1
272.2
73.4
162.5
30.2
51.1
71.6
105.7
109.6
76.5
Sahapur
n=42
23.3
284.6
25.1
208.9
124.4
179.0
35.8
44.4
116.2
110.2
110.0
83.2
Item
Home garden
Input
Cost (taka)
Repairing time (minutes)
Rice field
Cost (taka)
Repairing time (minutes)
Vegetable field Cost (taka)
Repairing time (minutes)
Bunds
Cost (taka)
Repairing time (minutes)
Irrigation canal Cost (taka)
Repairing time (minutes)
Other
Cost (taka)
Repairing time (minutes)
Total cost (taka)
Total time (minutes)
Jakunipara
n=73
33.9
22.8
43.4
23.5
9.9
14.6
28.4
102.7
1.4
4.9
89.9
34.4
522.7
1556.7
Sowara
n=45
51.0
15.7
12.7
13.2
12.0
12.8
14.5
51.0
4.7
19.2
64.8
24.8
367.2
663.6
No intervention
{
{
Intervention
Anandapur
n=48
79.5
138.1
140.1
135.9
66.8
127.2
16.0
108.3
17.1
71.6
102.6
91.7
741.5
1760.0
Sahapur
n=42
49.6
33.6
136.2
92.2
39.3
36.4
19.2
88.7
6.5
10.8
144.1
59.5
829.8
1231.5
n
ig
at
io
Irr
ld
f ie
ld
fie
al
ca
n
160
Bu
nd
s
e
ic
e
n
de
s
th
e
lo
tu
re
ga
r
bl
ta
R
om
e
ge
Ve
H
C
Fu
rn
i
sk
et
st
or
e
or
l
w
al
flo
Ba
ic
e
se
ou
se
ou
R
H
H
Mean household (n=100) expenditure (Taka)
Farmer recorded costs of repair
Intervention village
Non-intervention village
140
120
100
80
60
40
20
0
n
ig
at
io
Irr
ld
f ie
ld
fie
al
ca
n
450
Bu
nd
s
e
ic
e
n
de
s
th
e
lo
tu
re
ga
r
bl
ta
R
om
e
ge
Ve
H
C
Fu
rn
i
sk
et
st
or
e
or
l
w
al
flo
Ba
ic
e
se
ou
se
ou
R
H
H
Mean household (n=100) time (minutes)
Farmer recorded time spent to repair
Intervention village
Non-intervention village
400
350
300
250
200
150
100
50
0
Households in Jakunipara (intervention village) involved in recording
various repair activities within a farmer diary. Activities coincided with the
commencement of village-wide intensive trapping of rodents
Percentage of households undertaking repair
90
basket
clothes
rice store
furniture
house damage
80
70
60
50
40
30
20
10
0
1
2
3
4
5
6
7
8
9 10 11 12 13 14 15 16 17 18 19 20 21 22 23 24 25 26 27 28 29 30 31 32 33
week
Households in the village of
Anandapur (non-intervention
village) involved in recording
various repair activities within
a farmer diary
Percentage of households undertaking repair
90
house repair
basket
clothes
rice store
furniture
80
70
60
50
40
30
20
10
0
1
2
3
4
5
6
7
8
9 10 11 12 13 14 15 16 17 18 19 20 21 22 23 24 25 26 27 28 29 30 31 32 33
week
Activity
Trapping houses
Trapping rice field
Trapping vegetable field
Flooding burrow
Digging (house/bund)
Cleaning house
Input
Cost (taka)
Time (minutes)
Result (rats killed)
Cost (taka)
Time (minutes)
Result (rats killed)
Cost (taka)
Time (minutes)
Result (rats killed)
Cost (taka)
Time (minutes)
Result (rats killed)
Cost (taka)
Time (minutes)
Result (rats killed)
Cost (taka)
Time (minutes)
Result (rats killed)
Jakunipara
n=73
78.5
2162.8
17.5
2.5
65.8
0.4
1.5
72.8
0.4
0.2
37.0
0.2
2.9
57.1
0.2
1.6
2644.9
0.1
Sowara
n=45
82.9
2094.9
22.2
5.0
88.0
1.6
4.5
82.2
1.7
0.0
57.6
0.4
2.0
54.6
0.4
3.2
3268.8
0.0
No intervention
{
{
Intervention
Anandapur
n=48
0.0
0.0
0.0
0.0
0.0
0.0
0.0
0.0
0.0
1.5
66.4
0.6
8.3
76.2
0.5
8.3
4927.2
0.0
Sahapur
n=42
0.0
0.0
0.0
0.0
0.0
0.0
0.0
0.0
0.0
2.9
91.9
0.6
5.5
64.1
0.5
0.0
5553.3
0.0
Activity
Cleaning rice field/bund/canal
Cleaning vegetable field
Hunting
Lanirat (chronic poison)
Zinc Phosphide (acute poison)
Input
Cost (taka)
Time (minutes)
Result (rats killed)
Cost (taka)
Time (minutes)
Result (rats killed)
Cost (taka)
Time (minutes)
Result (rats killed)
Cost (taka)
Time (minutes)
Result (rats killed)
Cost (taka)
Time (minutes)
Result (rats killed)
Total cost (taka)
Total time (minutes)
Total result (rats killed)
Jakunipara
n=73
49.9
280.2
3.3
18.1
199.5
0.0
4.2
27.9
0.9
1.2
16.7
0.6
0.8
0.7
0.0
161.5
5565.3
23.7
Sowara
n=45
45.3
520.0
0.0
11.3
349.5
0.0
6.2
177.8
0.5
1.3
10.4
0.9
0.9
1.4
0.1
162.7
6705.2
27.9
No intervention
{
{
Intervention
Anandapur
n=48
65.7
639.8
7.5
53.1
661.1
0.0
3.9
60.8
1.3
4.9
62.6
3.1
11.8
32.8
0.5
157.5
6527.0
13.6
Sahapur
n=42
69.5
561.7
0.0
30.2
759.9
0.0
1.3
36.1
0.9
0.8
21.4
1.5
7.4
11.1
0.0
117.6
7099.5
3.6
Tracking tiles as a socio-economic tool
Tracking tiles as a socioeconomic tool
Tracking tiles as a socioeconomic tool
Rodents are too clever to be controlled
and become trap shy / poison shy
• Allows easy understanding of
changes in rodent population
dynamics
• Reduces need for dead bodies
• Efficacy of chronic poisons observed
• Encourages monitoring & evaluation
Yes
“New” management technology can
• Inform the research process
• Educate rodent managers
• Change human behaviour
Future challenges for
the social sciences in
rodent management
research
Human behaviour and disease
Damage remains hidden, impact on people’s
lives is unclear, economic cost is unknown
Disease mechanisms and transmission
Social stigmas and family decision making
processes – late treatment
Self-medication with inappropriate treatments
Community cohesion levels - acceptance,
apathy, dependence
Social conservatism – traditional treatments
and behaviour
Witchcraft and traditional medicine
• Belief in witchcraft, and that illnesses
are derived from bad luck, spells and
curses is widespread throughout many
countries
• Traditional healers can have
supernatural powers (for good and
bad) through spells and potions that
go beyond their administering of
herbal remedies to the sick.
• Rats are implicated in the spread of
witchcraft in many cultures. Because
rats are fast, they are believed to be
used to bewitch others and make them
ill - as a vessel of the curse sent by the
witch.
Rats, Hygiene and Sanitation
Concepts and socio-economics of disease
Traditional beliefs of hygiene can vary among
cultures and differ from modern scientific views,
e.g. internal dirt, not external dirt
Emphasis on tidiness rather than removal of
environmental dirt
Among young hygiene may relate to keeping one’s
body clean and among older people to keeping a
tidy kitchen
Food and water borne diseases – e.g. river water
always clean, wild animals are clean
Thanks to all my collaborators
and
Thank You for listening
