Study Guide 1 for Chapter 3, 4, 5 Test 2014
advertisement
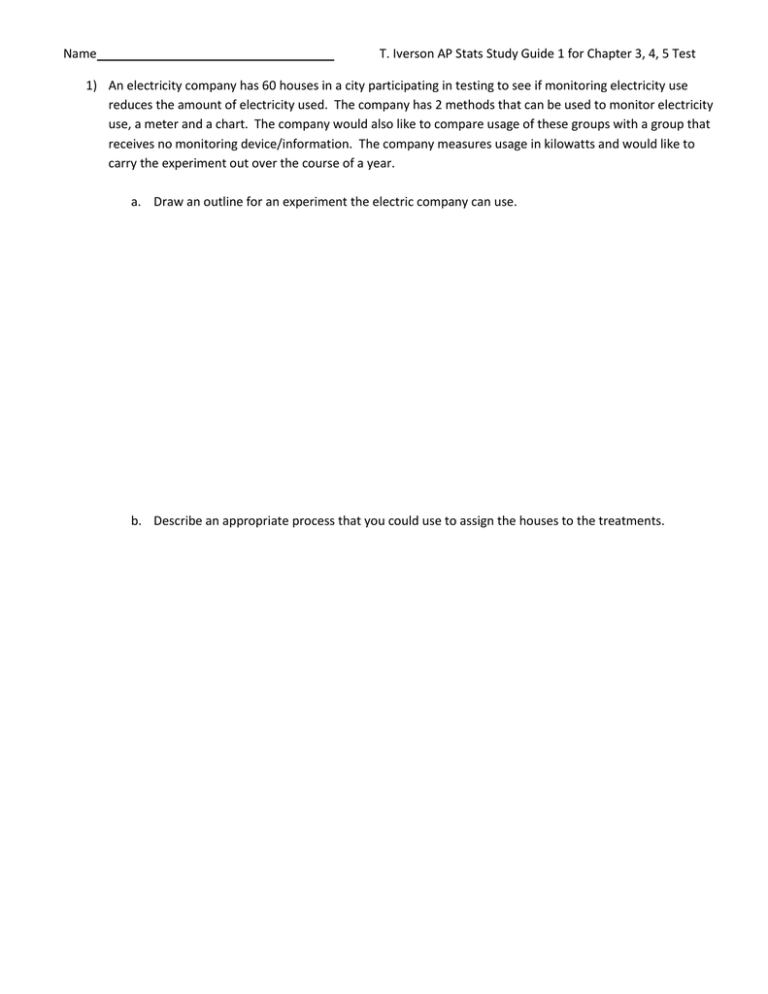
Name T. Iverson AP Stats Study Guide 1 for Chapter 3, 4, 5 Test 1) An electricity company has 60 houses in a city participating in testing to see if monitoring electricity use reduces the amount of electricity used. The company has 2 methods that can be used to monitor electricity use, a meter and a chart. The company would also like to compare usage of these groups with a group that receives no monitoring device/information. The company measures usage in kilowatts and would like to carry the experiment out over the course of a year. a. Draw an outline for an experiment the electric company can use. b. Describe an appropriate process that you could use to assign the houses to the treatments. c. What is the control group in this scenario? Why is it beneficial to have a control group for this experiment? d. What are the experimental units? e. What are the treatments? f. What is the response variable? g. Why is it important to randomize the assignment of the units to the treatments? 2) You are developing an experiment to test the difference in tread wear between a new tire design and an old tire design. It is known that tires wear differently when placed in the front compared to the rear of the car. You have 40 identical cars to test the difference in tread wear. Describe how you would carry out the experiment. Leonardo da Vinci, the renowned painter, speculated that an ideal human would have an armspan (distance from fingertips of outstretched arms) that was equal to his height. The following computer regression printout shows the results of a least-squares regression on height and armspan, in inches, for a sample of 18 high school students. Answer the following questions based of the printout. 3) State and interpret the correlation for this study. 4) State and interpret the coefficient of determination for this study. 5) Interpret the value of s . 6) Interpret the slope of the LSRL for this regression. 7) Write the equation of the LSRL.

