Grasp 3: Beers' Law
advertisement
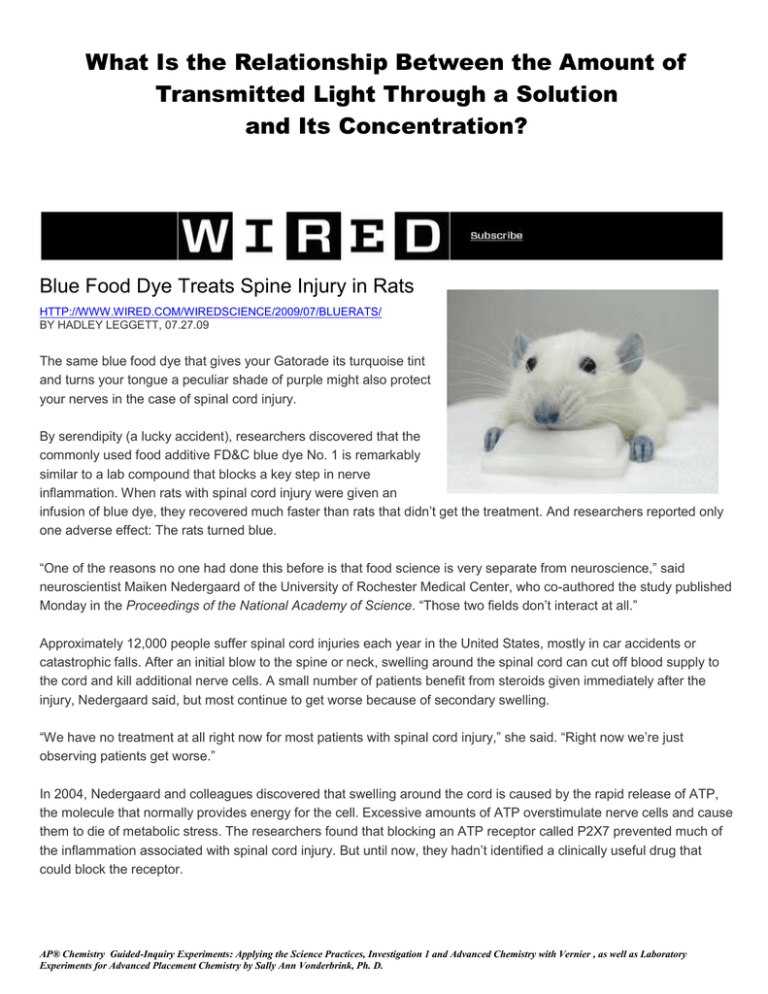
What Is the Relationship Between the Amount of Transmitted Light Through a Solution and Its Concentration? Blue Food Dye Treats Spine Injury in Rats HTTP://WWW.WIRED.COM/WIREDSCIENCE/2009/07/BLUERATS/ BY HADLEY LEGGETT, 07.27.09 The same blue food dye that gives your Gatorade its turquoise tint and turns your tongue a peculiar shade of purple might also protect your nerves in the case of spinal cord injury. By serendipity (a lucky accident), researchers discovered that the commonly used food additive FD&C blue dye No. 1 is remarkably similar to a lab compound that blocks a key step in nerve inflammation. When rats with spinal cord injury were given an infusion of blue dye, they recovered much faster than rats that didn’t get the treatment. And researchers reported only one adverse effect: The rats turned blue. “One of the reasons no one had done this before is that food science is very separate from neuroscience,” said neuroscientist Maiken Nedergaard of the University of Rochester Medical Center, who co-authored the study published Monday in the Proceedings of the National Academy of Science. “Those two fields don’t interact at all.” Approximately 12,000 people suffer spinal cord injuries each year in the United States, mostly in car accidents or catastrophic falls. After an initial blow to the spine or neck, swelling around the spinal cord can cut off blood supply to the cord and kill additional nerve cells. A small number of patients benefit from steroids given immediately after the injury, Nedergaard said, but most continue to get worse because of secondary swelling. “We have no treatment at all right now for most patients with spinal cord injury,” she said. “Right now we’re just observing patients get worse.” In 2004, Nedergaard and colleagues discovered that swelling around the cord is caused by the rapid release of ATP, the molecule that normally provides energy for the cell. Excessive amounts of ATP overstimulate nerve cells and cause them to die of metabolic stress. The researchers found that blocking an ATP receptor called P2X7 prevented much of the inflammation associated with spinal cord injury. But until now, they hadn’t identified a clinically useful drug that could block the receptor. AP® Chemistry Guided-Inquiry Experiments: Applying the Science Practices, Investigation 1 and Advanced Chemistry with Vernier , as well as Laboratory Experiments for Advanced Placement Chemistry by Sally Ann Vonderbrink, Ph. D. What is the Relationship Between the Concentration of a Solution and the Amount of Transmitted Light Through the Solution? “We just had proof of principle,” Nedergaard said. “We didn’t have anything we could give to patients.” Then, while searching for chemicals with structures similar to the P2X7 receptor, the scientists came across FD&C blue dye No. 1, completely non-toxic and approved by the FDA in 1928. “Each of us in United States eats about 14 milligrams of blue dye per day,” Nedergaard said. “It’s in anything blue, in M&Ms, in Gatorade, in Jell-O. We eat 100 million pounds a year in the U.S., so we already know that there’s no toxicity.” Another benefit of blue food dye is it crosses the blood-brain barrier. So instead of injecting the medicine into the spine, which would be dangerous in an injured patient, blue food dye can be delivered into a vein. To test whether the compound could improve recovery after spinal cord injury, rats were given an intravenous infusion of Brilliant Blue G, which is nearly identical to blue food dye, 15 minutes after a 10-gram weight was dropped on their spinal cords (under anesthesia). Animals who received the blue dye recovered much faster than animals who didn’t: By six weeks, the treatment group could walk with a limp, while the no-treatment group never recovered the ability to walk. “The paper presents novel findings, in a convincing manner,” wrote neurosurgeon Michael Fehlings of the University of Toronto, who specializes in spinal cord injury but was not involved in the research. When given 15 minutes after injury, the food dye appears to improve recovery and reduce inflammation, Fehlings said. But he pointed out several issues that need to be addressed before assuming the treatment could work in people. “The time window of 15 minutes post-injury is not clinically relevant,” Fehlings wrote in an e-mail. Most patients don’t make it to the emergency room within 15 minutes of getting hurt, so for the treatment to work, he said, it would have to be effective at least two hours after an injury. In addition, the rats experienced injury to their middle back, while most spinal cord injuries in humans are caused by damage to the neck and upper back. Nedergaard agrees that more research is necessary, and her group hopes to pursue a phase I clinical trial as soon they can get funding. Unfortunately, because blue food dye is so cheap, they’re not likely to find a drug company to sponsor the trials. “There’s no commercial interest because you can buy it by the pound,” Nedergaard said. “We’re planning a clinical trial here in Rochester, but we’ll have to wait for funding from the government.” AP® Chemistry Guided-Inquiry Experiments: Applying the Science Practices, Investigation 1 and Advanced Chemistry with Vernier , as well as Laboratory Experiments for Advanced Placement Chemistry by Sally Ann Vonderbrink, Ph. D. What is the Relationship Between the Concentration of a Solution and the Amount of Transmitted Light Through the Solution? How can light be used to study color and determine the concentration of a chemical species in solution? In light of the article you just read, it is obvious that one of the common challenges faced by chemists involves sample analysis. The goal of sample analysis is to answer the questions: "What chemicals are in this sample?" and "What are their concentrations?" If an “ingredient” is colored, then its concentration can be determined by light transmittance or light absorption. In this investigation, you will make a set of dilutions from a stock solution of known concentration containing the dye known as FD & C Blue #1 or Brilliant Blue. The dye’s chemical formula is C37H34N2Na2O9S3 and its structure is shown in Figure 1. Note that it exists as a sodium salt. Figure 1 You will use a Colorimeter, Figure 2 or a spectrophotometer to measure the transmittance of a set of solutions of known concentration. The amount of light transmitted by a colored solution is proportional to its concentration. A higher concentration of the colored solution absorbs more light (and transmits less) than a solution of lower concentration. The Colorimeter monitors the light received by the photocell as percent transmittance. Once the setting for the colorimetric device is established, you will prepare a series of standard solutions of FD & C Blue #1 dye from the standard solution of known molarity. Each diluted solution is transferred to a small, cuvette that is placed into the colorimeter or spectrophotometer. The amount of light that penetrates the solution and strikes the photocell is used to compute the transmittance of each solution. The transmittance will subsequently be converted into absorbance so that you may graph absorbance vs. concentration for the stock and diluted solutions, a direct relationship should result. The direct relationship between absorbance and concentration for a solution is known as Beer’s law, and the graph that you create is called a calibration plot or standard curve. You will next determine the concentration of FD & C Blue #1 dye in a sample of a blue sports drink by measuring its absorbance with the colorimeter or spectrophotometer. By locating the absorbance of the unknown on the vertical axis of the graph, the corresponding concentration can be found on the horizontal axis. The concentration of the unknown can also be found using the slope of the Beer’s law curve. Figure 2 OBJECTIVES Prepare and test the absorbance of the stock solution and seven diluted solutions. Establish a lambda max, max setting for the colorimeter or spectrophotometer. Construct a standard curve from the test results of the standard solutions. Test the transmittance of a FD & C Blue #1 from a popular sports drink and determine its concentration using your calibration plot (standard curve). AP® Chemistry Guided-Inquiry Experiments: Applying the Science Practices, Investigation 1 and Advanced Chemistry with Vernier , as well as Laboratory Experiments for Advanced Placement Chemistry by Sally Ann Vonderbrink, Ph. D. What is the Relationship Between the Concentration of a Solution and the Amount of Transmitted Light Through the Solution? MATERIALS Spectrophotometer or colorimeter & data collection device Stock solution of FD&C Blue #1 where Molarity = _________ one cuvette stirring rod 8 small test tubes or cups, labeled 1-8 test tube rack or large beaker for holding test tubes computer graphing software or graphing calculator tissues (preferably lint-free) disposable pipettes distilled or deionized water 10 mL graduated cylinders or small syringes PART I: ESTABLISHING THE SETTING FOR COLOIMETRIC ANALYSIS The setting for the colorimeter or spectrophotometer is not chosen arbitrarily. Your teacher will provide calibration information for the equipment you will be using. PART II: COLORIMETRIC ANALYSIS PROCEDURE 1. Obtain and wear goggles. If using a spectrophotometer, turn it on so the bulb may warm up while you prepare your diluted solutions. Be sure you have answered the Pre-Lab Questions prior to beginning this investigation. 2. Obtain about 50 mL of the stock solution. Record its concentration in mol/L (molarity). 3. Use the information in the chart below to make the dilutions. Use either a 10 mL graduated cylinder or small syringe to dispense precise amounts of each of the first two solutions from the proper dispensing buret into your labeled test tube or cup. Next, add deionized water carefully (use a pipette for the last few drops) to achieve a total solution volume of 10.0 mL. Thoroughly mix your solution with a stirring rod. Clean and dry the stirring rod. Solution Number Stock Solution (mL) H2O (mL) 1 2 3 4 5 6 7 8 10.0 8.0 6.0 4.0 3.0 2.0 1.0 0.0 0.0 2.0 4.0 6.0 7.0 8.0 9.0 10.0 4. Set up either the spectrophotometer or a data collection system. Solution #8 will serve as your “blank”. a. Start the data collection program. Be sure the program shows correct readings for the colorimeter. b. Set up data collection for Events with Entry. c. Follow the appropriate steps to calibrate the colorimeter or zero the spectrophotometer. AP® Chemistry Guided-Inquiry Experiments: Applying the Science Practices, Investigation 1 and Advanced Chemistry with Vernier , as well as Laboratory Experiments for Advanced Placement Chemistry by Sally Ann Vonderbrink, Ph. D. What is the Relationship Between the Concentration of a Solution and the Amount of Transmitted Light Through the Solution? 5. Collect and record the absorbance values for each of the eight solutions taking care to fill the cuvette about ¾ full. Be sure to wipe any fingerprints off the cuvette prior to taking any measurements. 6. Obtain a sample of the blue sports drink from your teacher and record its number in the data table for Part I. Use either the spectrophotometer or colorimeter to measure the absorbance of your unknown. Record your value in the Data Table for Part II. 7. Use graph paper or graphing software to construct a calibration plot which is a graph of absorbance vs. concentration. Print the graph if using computer software. 8. Discard the solutions as directed by your instructor. PART II: DATA TABLE Molar concentration of the stock solution: _____________________ Solution Number Stock Solution (mL) H2O (mL) 1 2 3 4 5 6 7 8 10.0 8.0 6.0 4.0 3.0 2.0 1.0 0.0 0.0 2.0 4.0 6.0 7.0 8.0 9.0 10.0 Molar Concentration (M) Measured Absorbance Sample Number: ______________ Measured absorbance: ___________ Equation for the line of best fit for the calibration plot (standard curve): Linear regression correlation coefficient value: ______________ Molar concentration of your unknown sample: _______________ AP® Chemistry Guided-Inquiry Experiments: Applying the Science Practices, Investigation 1 and Advanced Chemistry with Vernier , as well as Laboratory Experiments for Advanced Placement Chemistry by Sally Ann Vonderbrink, Ph. D. What is the Relationship Between the Concentration of a Solution and the Amount of Transmitted Light Through the Solution? PRE-LAB QUESTIONS 1. What is the name of the colored species being measured in this laboratory exercise? 2. Why is it important to fill the cuvette to about ¾ full? 3. Why is it important to wipe the cuvette with a lint-free tissue? 4. A second experiment was conducted to determine the best wavelength setting for a different FD & C dye. The experiment used a spectrophotometer and collected absorbance data for a given sample of the dye at 10 nm wavelength increments starting at 360 nm and ending at 620 nm. The graph of the data is shown at right. Explain how this graph is used to determine the wavelength setting for this experiment. 5. A student is given the task of determining the molar concentration for a sample of copper(II) sulfate solution of “unknown” concentration. In order to establish a standard or calibration curve, the student prepares a set of five solutions of copper(II) sulfate and calculates the molarities. Next, the student measures the absorbance of each solution. The student’s data is shown in the following table. Standard 1 2 3 4 5 Concentration (mol/L) 0.0800 0.160 0.240 0.320 0.400 Absorbance 0.205 0.404 0.599 0.789 0.982 (a) Use the set of axes provided to graph the data. What is the equation for the calibration plot (standard curve or line of best fit)? (b) The student then measures the absorbance for the unknown sample and determines it to be 0.669. Determine the concentration of the unknown CuSO4 solution and explain your method. AP® Chemistry Guided-Inquiry Experiments: Applying the Science Practices, Investigation 1 and Advanced Chemistry with Vernier , as well as Laboratory Experiments for Advanced Placement Chemistry by Sally Ann Vonderbrink, Ph. D. What is the Relationship Between the Concentration of a Solution and the Amount of Transmitted Light Through the Solution? POST-LAB QUESTIONS AND DATA ANALYSIS 1. Use computer graphing software to plot your data and run a linear regression analysis to evaluate your standard curve. Print your graph and be sure you include the equation for your linear-regression and the value of the linear regression correlation coefficient. 2. What statistical indicator convinces you that your data is trustworthy? Justify your answer. 3. Determine the concentration of the unknown solution. Justify your answer. 4. Beer’s Law appears in the “Gases, Liquids and Solutions” section of the AP Chemistry Formula Sheet as A = abc but is more commonly seen in reference material as A c . Either way A = absorbance, a or ε = molar absorptivity (a constant specific to each solution), b or = path length of the cuvette in which the sample is contained, and c = concentration in mol/L or molarity. Calculate the concentration of a solution having an absorbance equal to 0.600 and a molar absorptivity constant of 5.00 × 10⁻³ cm−1 M −1 with a path length of 1.0 cm. 5. A student fails to insert the cuvette into the colorimeter or spectrophotometer correctly. What effect will this have on the measured absorbance? AP® Chemistry Guided-Inquiry Experiments: Applying the Science Practices, Investigation 1 and Advanced Chemistry with Vernier , as well as Laboratory Experiments for Advanced Placement Chemistry by Sally Ann Vonderbrink, Ph. D.
