Elevation Profile and Water Quality Introduction
advertisement
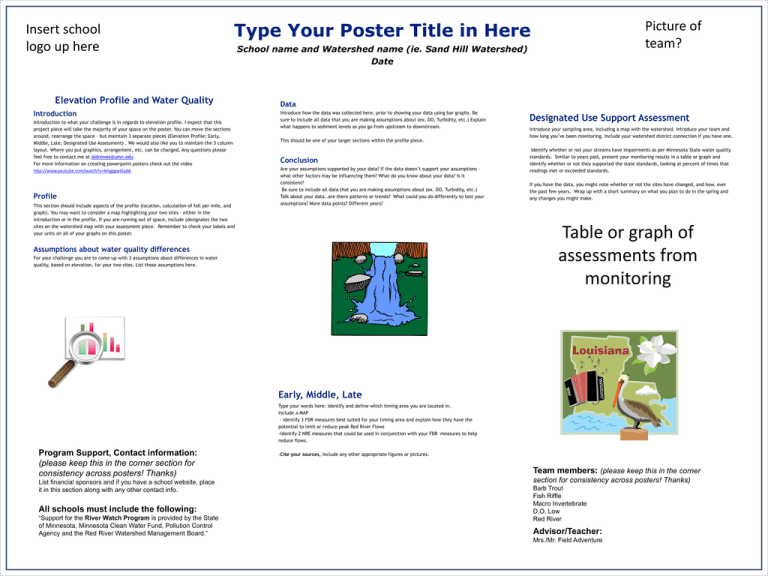
Insert school logo up here Type Your Poster Title in Here Elevation Profile and Water Quality Introduction Introduction to what your challenge is in regards to elevation profile. I expect that this project piece will take the majority of your space on the poster. You can move the sections around, rearrange the space – but maintain 3 separate pieces (Elevation Profile; Early, Middle, Late; Designated Use Assessment) . We would also like you to maintain the 3 column layout. Where you put graphics, arrangement, etc. can be changed. Any questions please feel free to contact me at aldrewes@umn.edu For more information on creating powerpoint posters check out the video http://www.youtube.com/watch?v=MqgjgwIXadA Profile This section should include aspects of the profile (location, calculation of fall per mile, and graph). You may want to consider a map highlighting your two sites – either in the introduction or in the profile. If you are running out of space, include (designate) the two sites on the watershed map with your assessment piece. Remember to check your labels and your units on all of your graphs on this poster. Picture of team? School name and Watershed name (ie. Sand Hill Watershed) Date Data Introduce how the data was collected here, prior to showing your data using bar graphs. Be sure to include all data that you are making assumptions about (ex. DO, Turbidity, etc.) Explain what happens to sediment levels as you go from upstream to downstream. This should be one of your larger sections within the profile piece. Conclusion Are your assumptions supported by your data? If the data doesn’t support your assumptions – what other factors may be influencing them? What do you know about your data? Is it consistent? Be sure to include all data that you are making assumptions about (ex. DO, Turbidity, etc.) Talk about your data..are there patterns or trends? What could you do differently to test your assumptions? More data points? Different years? Designated Use Support Assessment Introduce your sampling area, including a map with the watershed. Introduce your team and how long you’ve been monitoring. Include your watershed district connection if you have one. Identify whether or not your streams have impairments as per Minnesota State water quality standards. Similar to years past, present your monitoring results in a table or graph and identify whether or not they supported the state standards, looking at percent of times that readings met or exceeded standards. If you have the data, you might note whether or not the sites have changed, and how, over the past few years. Wrap up with a short summary on what you plan to do in the spring and any changes you might make. Table or graph of assessments from monitoring Assumptions about water quality differences For your challenge you are to come up with 3 assumptions about differences in water quality, based on elevation, for your two sites. List those assumptions here. Early, Middle, Late Type your words here: Identify and define which timing area you are located in. Include a MAP - Identify 3 FDR measures best suited for your timing area and explain how they have the potential to limit or reduce peak Red River Flows -Identify 2 NRE measures that could be used in conjunction with your FDR measures to help reduce flows. Program Support, Contact information: (please keep this in the corner section for consistency across posters! Thanks) List financial sponsors and if you have a school website, place it in this section along with any other contact info. All schools must include the following: “Support for the River Watch Program is provided by the State of Minnesota, Minnesota Clean Water Fund, Pollution Control Agency and the Red River Watershed Management Board.” -Cite your sources, include any other appropriate figures or pictures. Team members: (please keep this in the corner section for consistency across posters! Thanks) Barb Trout Fish Riffle Macro Invertebrate D.O. Low Red River Advisor/Teacher: Mrs./Mr. Field Adventure
