Daniel J. Bates , Iris T. Stewart-Frey and Edwin P. Maurer
advertisement

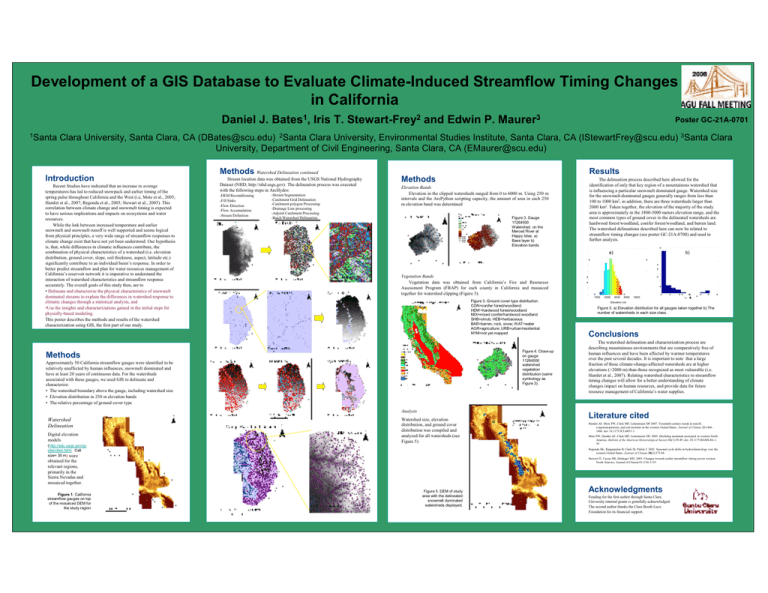
Development of a GIS Database to Evaluate Climate-Induced Streamflow Timing Changes in California Daniel J. Bates1, Iris T. Stewart-Frey2 and Edwin P. Maurer3 1Santa Poster GC-21A-0701 Clara University, Santa Clara, CA (DBates@scu.edu) 2Santa Clara University, Environmental Studies Institute, Santa Clara, CA (IStewartFrey@scu.edu) 3Santa Clara University, Department of Civil Engineering, Santa Clara, CA (EMaurer@scu.edu) Introduction Recent Studies have indicated that an increase in average temperatures has led to reduced snowpack and earlier timing of the spring pulse throughout California and the West (i.e, Mote et al., 2005; Hamlet et al., 2007; Regonda et al., 2005; Stewart et al., 2005). This correlation between climate change and snowmelt timing is expected to have serious implications and impacts on ecosystems and water resources. While the link between increased temperature and earlier snowmelt and snowmelt runoff is well supported and seems logical from physical principles, a very wide range of streamflow responses to climate change exist that have not yet been understood. Our hypothesis is, that, while differences in climatic influences contribute, the combination of physical characteristics of a watershed (i.e. elevation distribution, ground cover, slope, soil thickness, aspect, latitude etc.) significantly contribute to an individual basin’s response. In order to better predict streamflow and plan for water resources management of California’s reservoir network it is imperative to understand the interaction of watershed characteristics and streamflow response accurately. The overall goals of this study then, are to • Delineate and characterize the physical characteristics of snowmelt dominated streams to explain the differences in watershed response to climatic changes through a statistical analysis, and •Use the insights and characterizations gained in the initial steps for physially-based modeling. This poster describes the methods and results of the watershed characterization using GIS, the first part of our study. Methods Watershed Delineation continued Stream location data was obtained from the USGS National Hydrography Dataset (NHD; http://nhd.usgs.gov). The delineation process was executed with the following steps in ArcHydro: -DEM Reconditioning -Fill Sinks -Flow Direction -Flow Accumulation -Stream Definition -Stream Segmentation -Catchment Grid Delineation -Catchment polygon Processing -Drainage Line processing -Adjoint Catchment Processing -Batch Watershed Delineation Elevation Bands Elevation in the clipped watersheds ranged from 0 to 6000 m. Using 250 m intervals and the ArcPython scripting capacity, the amount of area in each 250 m elevation band was determined Figure 3. Gauge 11264500 Watershed on the Merced River at Happy Isles. a) Base layer b) Elevation bands 1000 Figure 3. Ground cover type distribution. CON=conifer forest/woodland; HDW=hardwood forest/woodland MIX=mixed conifer/hardwood woodland SHB=shrub; HEB=herbaceous BAR=barren, rock, snow; WAT=water AGR=agriculture; URB=urban/residential NYM=not yet mapped Figure 4. Close-up on gauge 11264500 watershed vegetation distribution (same symbology as Figure 3). Analysis Watershed size, elevation distribution, and ground cover distribution was compiled and analyzed for all watersheds (see Figure 5) 2000 3000 4000 5000 Elevation (m) Figure 3. a) Elevation distribution for all gauges taken together b) The number of watersheds in each size class. Conclusions The watershed delineation and characterization process are describing mountainous environments that are comparatively free of human influences and have been affected by warmer temperatures over the past several decades. It is important to note that a large fraction of these climate-change-affected watersheds are at higher elevations (>2000 m) than those recognized as most vulnerable (i.e. Hamlet et al., 2007). Relating watershed characteristics to streamflow timing changes will allow for a better understanding of climate changes impact on human resources, and provide data for future resource management of California’s water supplies. Literature cited Hamlet AF, Mote PW, Clark MP, Lettenmaier DP 2007. Twentieth-century trends in runoff, evapotranspiration, and soil moisture in the western United States. Journal of Climate 20:1468 – 1486. doi: 10.1175/JCLI4051.1 Mote PW, Hamlet AF, Clark MP, Lettenmaier DP. 2005. Declining mountain snowpack in western North America. Bulletin of the American Meteorological Society 86(1):39-49. doi: 10.1175/BAMS-86-139 Regonda SK, Rajagopalan B, Clark M, Pitlick J. 2005. Seasonal cycle shifts in hydroclimatology over the western United States. Journal of Climate 18(2):372-84. ides/dem.html. Cell size= 30 m) were obtained for the relevant regions, primarily in the Sierra Nevadas and mosaiced together. Figure 1. California streamflow gauges on top of the mosaiced DEM for the study region b) Vegetation Bands Vegetation data was obtained from California’s Fire and Resources Assessment Program (FRAP) for each county in California and mosaiced together for watershed clipping (Figure 3). Approximately 50 California streamflow gauges were identified to be relatively unaffected by human influences, snowmelt dominated and have at least 20 years of continuous data. For the watersheds associated with these gauges, we used GIS to delineate and characterize: • The watershed boundary above the gauge, including watershed size • Elevation distribution in 250 m elevation bands • The relative percentage of ground cover type Digital elevation models (http://edc.usgs.gov/gu The delineation process described here allowed for the identification of only that key region of a mountainous watershed that is influencing a particular snowmelt dominated gauge. Watershed size for the snowmelt-dominated gauges generally ranges from less than 100 to 1000 km2, in addition, there are three watersheds larger than 2000 km2. Taken together, the elevation of the majority of the study area is approximately in the 1800-3000 meters elevation range, and the most common types of ground cover in the delineated watersheds are hardwood forest/woodland, conifer forest/woodland, and barren land. The watershed delineations described here can now be related to streamflow timing changes (see poster GC-21A-0700) and used in further analysis. a) Methods Watershed Delineation Results Methods Stewart IT, Cayan DR, Dettinger MD, 2005. Changes towards earlier streamflow timing across western North America. Journal of Climate18:1136-1155 Figure 5. DEM of study area with the delineated snowmelt dominated watersheds displayed. Acknowledgments Funding for the first author through Santa Clara University internal grants is gratefully acknowledged. The second author thanks the Clare Booth Luce Foundation for its financial support.


