File
advertisement

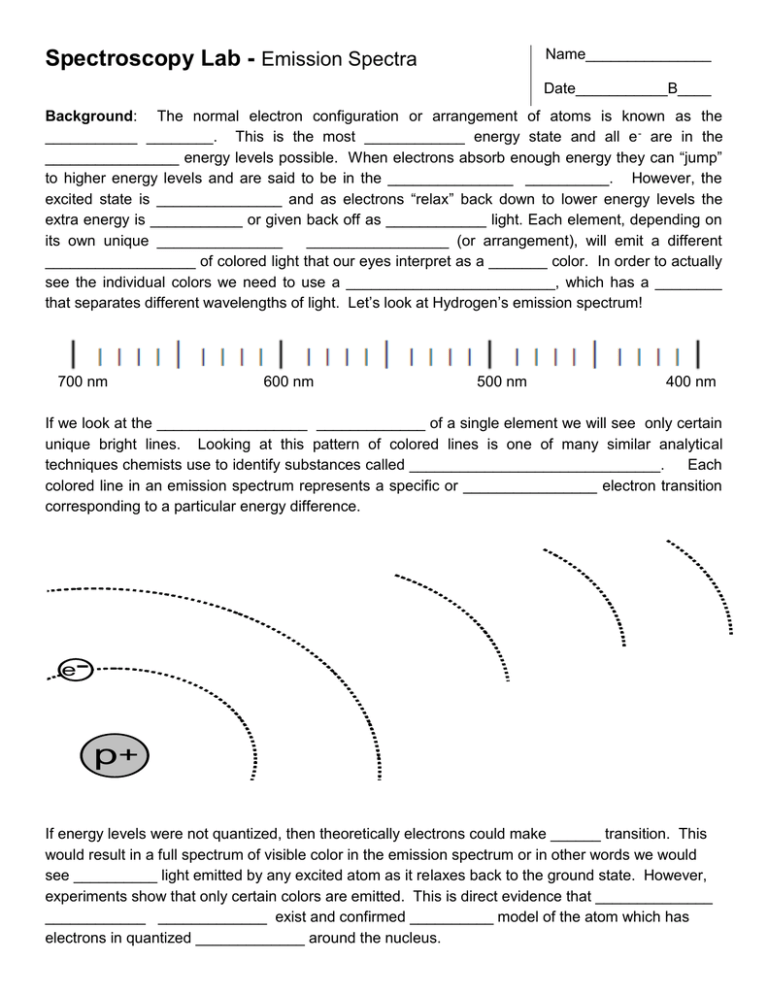
Name_______________ Spectroscopy Lab - Emission Spectra Date___________B____ Background: The normal electron configuration or arrangement of atoms is known as the ___________ ________. This is the most ____________ energy state and all e - are in the ________________ energy levels possible. When electrons absorb enough energy they can “jump” to higher energy levels and are said to be in the _______________ __________. However, the excited state is _______________ and as electrons “relax” back down to lower energy levels the extra energy is ___________ or given back off as ____________ light. Each element, depending on its own unique _______________ _________________ (or arrangement), will emit a different __________________ of colored light that our eyes interpret as a _______ color. In order to actually see the individual colors we need to use a _________________________, which has a ________ that separates different wavelengths of light. Let’s look at Hydrogen’s emission spectrum! 700 nm 600 nm 500 nm 400 nm If we look at the __________________ _____________ of a single element we will see only certain unique bright lines. Looking at this pattern of colored lines is one of many similar analytical techniques chemists use to identify substances called ______________________________. Each colored line in an emission spectrum represents a specific or ________________ electron transition corresponding to a particular energy difference. e- p+ If energy levels were not quantized, then theoretically electrons could make ______ transition. This would result in a full spectrum of visible color in the emission spectrum or in other words we would see __________ light emitted by any excited atom as it relaxes back to the ground state. However, experiments show that only certain colors are emitted. This is direct evidence that ______________ ____________ _____________ exist and confirmed __________ model of the atom which has electrons in quantized _____________ around the nucleus. Spectroscopy Lab - Emission Spectra Name_______________ Date___________B____ Electromagnetic Spectrum Review BOHR Model of the Atom QUANTUM Model of the Atom Spectroscopy Lab - Emission Spectra Name_______________ Date___________B____ Pre-Lab Questions: 1. Large electronic transitions will result in ________________ energy light being emitted. This light will be closer to the _________ color end of the visible spectrum. This light will have a higher _________________ and a ____________ wavelength. Small electronic transitions will result in ________________ energy light being emitted. This light will be closer to the _________ color end of the visible spectrum. This light will have a _________________ frequency and a longer _________________. 2a. Draw the excitation of a ground state electron in Hydrogen from n=1 n=4 followed by relaxation to the lower n=3 level. 2b. Draw a transition for a ground state electron in a Hydrogen atom that would result in a longer wavelength emission. 3. What do chemists mean when they say “energy levels are quantized”? 4. How are orbits and orbitals different? Name_______________ Spectroscopy Lab - Emission Spectra Date___________B____ Background: Elements in the gaseous state give off specific colors when excited by electricity. This light can be viewed through a prism which separates it into specific wavelengths of visible light. This is called the emission spectrum and it is a direct result of quantized electronic transitions between specific energy levels within the atom. Objective: Identify an element based on its emission spectrum. Use emission spectrum results as evidence for quantized energy levels in the quantum model Materials: Spectrum tubes are expensive and extremely fragile – ONLY JOE WILL HANDLE THEM! Spectroscopes have two fragile prisms at both end. Be careful not to disrupt them. Safety: Spectrum tubes can only be used in 30 sec intervals or they will burn out. Extreme caution should be used because the tubes can get very hot and the power supply is high voltage. Procedure: 1. Use a spectroscope to sketch (use colored pencils) the emission spectrum of three mystery elements. 2. Identify which element(s) are in the classroom lights 3. Identify which element(s) are most abundant in our sun Data: PRACTICE ELEMENT : Hydrogen 700 nm 600 nm 500 nm 400 nm 600 nm 500 nm 400 nm 600 nm 500 nm 400 nm 600 nm 500 nm 400 nm 600 nm 500 nm 400 nm HELIUM : 700 nm MERCURY: 700 nm NEON 700 nm (Classroom Lights) 700 nm Spectroscopy Lab - Emission Spectra Name_______________ Date___________B____ Keywords: energy, absorb, emit, ground, excited, transition, wavelength or frequency, quantized RESULTS: Use the “accepted spectrum” for H, He, Hg, and Ne provided in class. 1) Analyze the “Solar” absorption spectrum of our sun. Determine which two elements are most abundant in our sun using qualitative (color) and quantitative (wavelength) data. 2) Analyze the “Unknown” emission spectrum (classroom lights). Determine which element(s) make up the classroom lights using qualitative (color) and quantitative (wavelength) data. DISCUSSION: 1) Electron Transitions a) Draw the excitation from n=1 n=3 for a ground state electron in a Hydrogen atom followed by relaxation to the lower n=2 level. b) Based on your answer to #1a), now Draw a transition (you choose the energy levels) for a ground state electron in a Hydrogen atom that would result in a shorter wavelength emission. 2) Explain why the element tubes do not glow when the power is off. Why do they glow when the power is on? Describe the process of e- transitions and how they result in emission spectra. 3) Our sun is 93 million miles away. Other stars are billions or even further away. Astronomers use variety of techniques in their search for extrasolar planets and extraterrestrial life. Knowing the temperature of a star and whether or not it’s planets have atmospheres with gases like our own are important steps in the search for life elsewhere in the universe. (a) Explain how astronomers are able to determine the elemental and molecular composition of stars and the atmospheres so far away. (b) What technique do they (and did we) use? CONCLUSION: 1) Describe the major source of experimental (unavoidable) error in the lab. How was it minimized? 2) Bohr created his model of quantized energy levels and orbits because it explained the emission spectrum of hydrogen. Although Bohr’s model failed for elements with more complicated econfigurations it is still useful for depicting e- transitions. Compare and contrast the Bohr Model and the Quantum Model of the atom. How is the location and understanding of e- different in the Bohr vs. Quantum models? What do chemists mean when they say “electrons exist in quantized energy levels”? EXTRA CREDIT: Chemists can not touch or see atoms so we must use inference to support our theories on atomic structure. In both the Bohr and Quantum models, e- are restricted to only specific energy levels. Explain how the spectral lines in emission spectra are evidence for quantized energy levels. Explain why only certain bright colored lines are seen in the emission spectra? What would we observe if energy levels were not quantized? Spectroscopy Lab - Emission Spectra Name_______________ Date___________B____ Score Compares energy, color, frequency, and wavelength of transitions Diagrams electron transitions using Bohr model orbits Defines “quantized” and explains “orbits” vs. “orbitals” Results 20 pts Analyze the “Solar” absorption spectrum of our sun. Discussion 25 pts Thoroughly sketches four complete spectra as accurately as possible Correctly draws electron transitions Conclusion 15 pts Data 20 pts Pre-Lab 20 pts Spectroscopy Lab Rubric Criteria for “Expert” Describes the major source of error in the lab & how it was minimized. Analyze the “Unknown” emission spectrum (classroom lights). Describe the process of e- transitions and how they result in emission spectra. Explain how astronomers are able to determine the composition of stars Compare and contrast the Bohr and Quantum models of the atom. Extra Credit: Explain how spectral lines are evidence for quantized energy levels. Teacher Comments: TOTAL =


