Long Run and Short Run costs KEY
advertisement
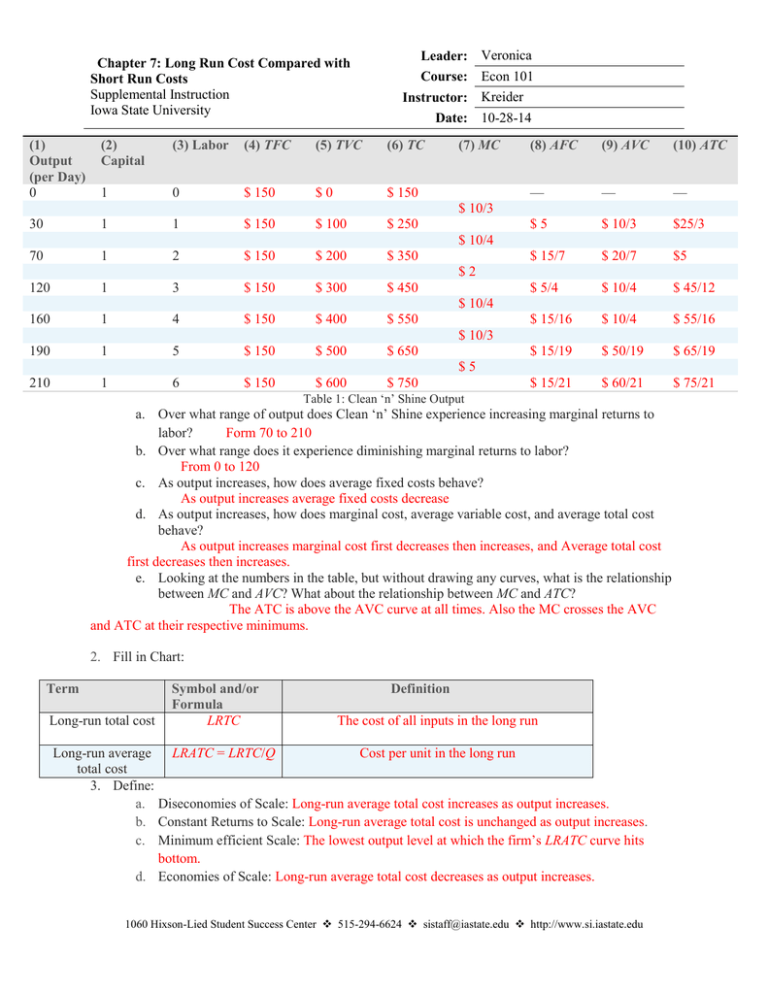
Chapter 7: Long Run Cost Compared with Short Run Costs Supplemental Instruction Iowa State University (1) Output (per Day) 0 Leader: Veronica Course: Econ 101 Instructor: Kreider Date: 10-28-14 (2) Capital (3) Labor (4) TFC (5) TVC (6) TC 1 0 $ 150 $0 $ 150 (7) MC (8) AFC (9) AVC (10) ATC — — — $5 $ 10/3 $25/3 $ 15/7 $ 20/7 $5 $ 5/4 $ 10/4 $ 45/12 $ 15/16 $ 10/4 $ 55/16 $ 15/19 $ 50/19 $ 65/19 $ 15/21 $ 60/21 $ 75/21 $ 10/3 30 1 1 $ 150 $ 100 $ 250 $ 10/4 70 1 2 $ 150 $ 200 $ 350 120 1 3 $ 150 $ 300 $ 450 $2 $ 10/4 160 1 4 $ 150 $ 400 $ 550 $ 10/3 190 1 5 $ 150 $ 500 $ 650 210 1 6 $ 150 $ 600 $ 750 $5 Table 1: Clean ‘n’ Shine Output a. Over what range of output does Clean ‘n’ Shine experience increasing marginal returns to labor? Form 70 to 210 b. Over what range does it experience diminishing marginal returns to labor? From 0 to 120 c. As output increases, how does average fixed costs behave? As output increases average fixed costs decrease d. As output increases, how does marginal cost, average variable cost, and average total cost behave? As output increases marginal cost first decreases then increases, and Average total cost first decreases then increases. e. Looking at the numbers in the table, but without drawing any curves, what is the relationship between MC and AVC? What about the relationship between MC and ATC? The ATC is above the AVC curve at all times. Also the MC crosses the AVC and ATC at their respective minimums. 2. Fill in Chart: Term Long-run total cost Symbol and/or Formula LRTC Definition The cost of all inputs in the long run Long-run average LRATC = LRTC/Q Cost per unit in the long run total cost 3. Define: a. Diseconomies of Scale: Long-run average total cost increases as output increases. b. Constant Returns to Scale: Long-run average total cost is unchanged as output increases. c. Minimum efficient Scale: The lowest output level at which the firm’s LRATC curve hits bottom. d. Economies of Scale: Long-run average total cost decreases as output increases. 1060 Hixson-Lied Student Success Center 515-294-6624 sistaff@iastate.edu http://www.si.iastate.edu 4. The following table gives the short-run and long-run total costs for various levels of output of Consolidated National Acme, Inc.: Q 0 1 2 3 4 5 6 7 TC1 0 300 400 465 495 540 600 700 c. TC2 350 400 435 465 505 560 635 735 a. Which column, TC1 or TC2, gives longrun total cost, and which gives short-run total cost? How do you know? TC1 is Long run & TC2 is short run. You know because TC1 has no fixed costs & in long run cost curves all inputs are variable. b. For each level of output, find short-run TFC, TVC, AFC, AVC, and MC. At what output level would the firm’s short-run and long-run input combinations be the same? At a quantity of 3 d. Over what range of output do you see economies of scale? Diseconomies of scale? Constant returns to scale? For TC1: Economies of Scale from 0-6. Constant returns to scale from 6-7. No Diseconomies of Scale For TC2 : Economies of Scale from 0-7. No Constant returns to scale. No Diseconomies of Scale 5. “If a firm has diminishing returns to labor over some range of output, it cannot have economies of scale over that range.” True or false? Explain briefly. True because they are opposites of each other. 5. Fill in the Blank: a. In the long run, there are no fixed inputs or fixed costs; all inputs and all costs are variable. b. The long-run total cost of producing a given level of output can be less than or equal to, but not greater than, the short-run total cost (LRTC ≤ TC) c. The long-run average cost of producing a given level of output can be less than or equal to, but not greater than, the short-run average total cost (LRATC ≤ ATC). d. A firm’s LRATC curve combines portions of each ATC curve available to the firm in the long run. For each output level, the firm will always choose to operate on the ATC curve with the lowest possible cost. e. in the short run, a firm can only move along its current ATC curve. In the long run, however, it can move from one ATC curve to another by varying the size of its plant. As it does so, it will also be moving along its LRATC curve. f. When long-run total cost rises proportionately less than output, production is characterized by economies of scale, and the LRATC curve slopes downward. g. when long-run total cost rises more than in proportion to output, there are diseconomies of scale, and the LRATC curve slopes upward.

