Supplementary Information (doc 1068K)
advertisement
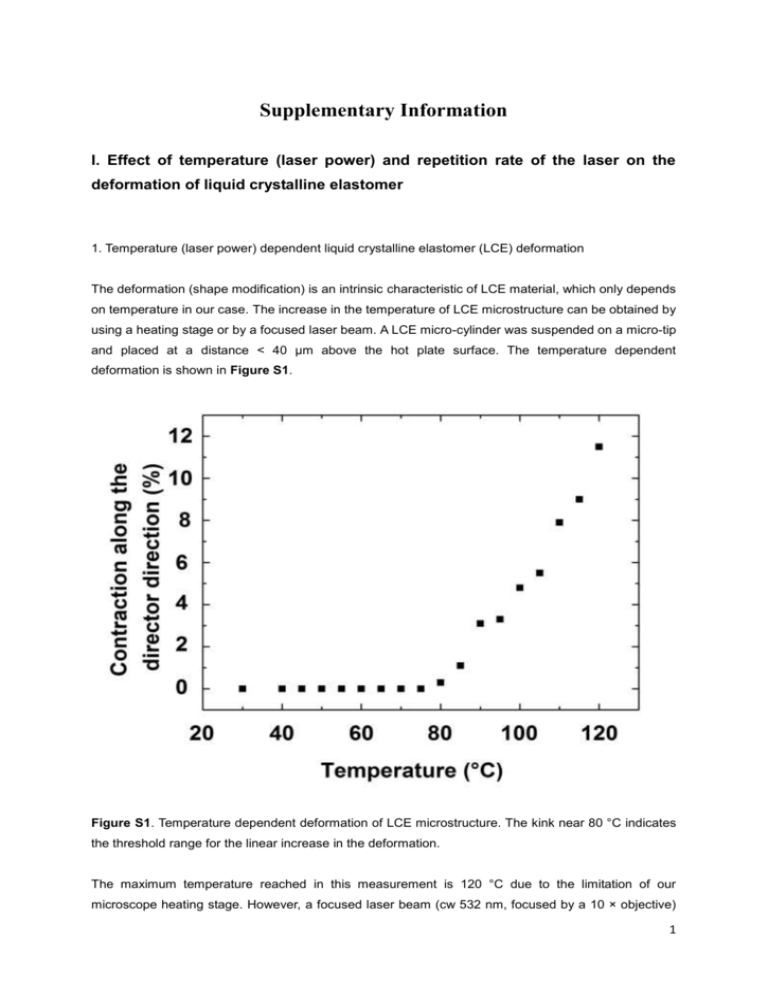
Supplementary Information I. Effect of temperature (laser power) and repetition rate of the laser on the deformation of liquid crystalline elastomer 1. Temperature (laser power) dependent liquid crystalline elastomer (LCE) deformation The deformation (shape modification) is an intrinsic characteristic of LCE material, which only depends on temperature in our case. The increase in the temperature of LCE microstructure can be obtained by using a heating stage or by a focused laser beam. A LCE micro-cylinder was suspended on a micro-tip and placed at a distance < 40 µm above the hot plate surface. The temperature dependent deformation is shown in Figure S1. Figure S1. Temperature dependent deformation of LCE microstructure. The kink near 80 °C indicates the threshold range for the linear increase in the deformation. The maximum temperature reached in this measurement is 120 °C due to the limitation of our microscope heating stage. However, a focused laser beam (cw 532 nm, focused by a 10 × objective) 1 can evoke higher temperature in the LCE actuators, thus induce a larger deformation, as shown in Figure S2. Here the laser power is measured from the output of the cw laser, and the LCE structure is suspended the same as before. Figure S2. Laser power dependent deformation of LCE microstructure. 2. Dependence of LCE deformation and response on the repetition rate of the laser The speed of the photo-response of LCE depends on the rate of temperature change inside the microstructure. Actuation/deformation (when the laser is on) is due to heat deposition in the LCE by light absorption by the azo dye, while relaxation (when the laser is off) is due to heat dissipation to the environment. This process is slow compared to the millisecond time scale corresponding to the experimental 1 kHz repetition rate. In video 1 and 2, the laser repetition rate is only 2 Hz and 4 Hz. For such a low repetition rate, the LCE structure follows directly the modulated laser power and reaches maximum deformation. The main aim of these videos is to show the light induced deformation (expansion and contraction) in LCE structures. When the repetition rate of the laser (both chopped cw laser and pulsed laser) is increased, the LCE deformation cannot “keep pace” with the modulated laser intensity resulting in a stationary deformation (and thus a stationary shift of the laser modes). In the range of high repetition rate (e.g. 1 kHz) the shape modification of the LCE (and the resonance shift) only depends on the average laser power. Note that, in order to visualize the deformation (>20%), we chose large laser power (45-50 mW). However, for the WGM laser tuning in Figure 5, the deformation of the LCE is quite small (<1% for a few mW laser excitation). 2 Larger laser power triggers larger LCE deformation. However, such high laser power is avoided because of two major effects. In one hand both Pyrromethene 597 laser dye and azo dye are easily bleached up on high laser power exposure. On the other hand increasing the power will increase the deformation of the cavity but reduce the reversibility of the modal tuning. The goblet cavity is like spring-mass system, where the deformation above a certain extension length leads to a permanent shape change or even structural damage. To study the LCE deformation vs time, we used fast speed camera to observe deformation under different repetition rate of a chopped cw laser. In 10 Hz repetition rate under a certain power, the LCE structure has a deformation of ~5% and the shape modulation follows the chopper frequency. In 100 Hz, the structure has only a little observable shape modulation, while in 1 kHz the structure is totally stable. In high repetition rate, LCE treats the pulse laser as a cw light source. Thus, the LCE deformation only depends on the average pump power. For this purpose, we used 1 kHz repetition rate pumping laser in order to achieve a stable lasing spectrum. Thus tuning of microgoblet lasing can be realized in a perfectly controlled and reversible way only by controlling the power. Still, due to the optical resolution we cannot measure the nano-scale shape modification of LCE under low power. However, the shift of WGM modes reveals the shape modification of LCE structure/cavity dimension (according to Δλ/λ= ΔR/R, where λ is the wavelength of the laser mode and R is the radius of the cavity). At low repetition rate LCE deformation can follow up with the pulsed laser, then LCE induces cavity shape change during the spectrum recording. Thus we obtain a lasing spectrum which is not stable in 10 Hz and 100 Hz repetition rate. While the repetition rate increases to 1 kHz, the deformation of LCE becomes stable, and hence we are able to control the shift in lasing spectrum. II. Transmission spectrum experimental setup A single mode optical fiber SM600 (for propagation of 600 nm light; 125 µm cladding diameter) is adiabatically tapered to ~ 1 µm using flame brushing technique. For the transmission spectra measurement, the tapered fiber is placed on a 5 axis positioning stage (with a resolution of 20 nm) and two cameras are used from the top and the side to monitor the exact position of the fiber and the cavity as depicted in Figure S3. One end of the tapered fiber is connected to a tunable diode laser (New Focus Velocity TLB 6304) with a tuning range from 632.5 nm to 637 nm and with line-width less than 300 kHz (<0.3 fm). The tapered part of the fiber is brought close to the cavity. The transmitted light is collected via a photo-diode and the spectrum is analyzed with a LabVIEW (National Instrument) program. The distance between the resonator and the tapered fiber is adjusted until the WGMs appear as sharp dips in the transmission spectrum. 3 Figure S3. Experimental setup for transmission spectrum measurement. III. Micro-photoluminescence experimental setup The LCE/PMMA micro-goblet laser cavities were pumped with a frequency-doubled neodymiumdoped yttrium orthovanadate (Nd:YVO4) pulsed laser at a pump wavelength of 532 nm and a repetition rate of 1 kHz. The excitation pump beam is focused in a free-space micro-photoluminescence (µ-PL) setup (as shown in Figure S4) under an angle of 45°. The emission from the cavity is collected perpendicular to the resonator axis by a 50× microscope objective (NA= 0.4) and directed to a spectrometer (grating with 1200 lines/mm, of resolution 60 pm) equipped with CCD (charge coupled device) camera. This setup also provides spatially resolved information about the emitted laser modes along the vertical diameter of the cavity utilizing the dimension of the CCD pixel array parallel to the alignment of the spectrometer entrance slit. 4 Figure S4. Micro-photoluminescence setup for free space excitation 5


