Name: ________________________
Applications of Sine and Cosine Graphs Learning Task:
Trigonometry functions are often used to model periodic data. Let’s look at a few examples of real-world
situations that can best be modeled using trigonometric functions.
Answer any two of the following 3 questions.
1. Musical Tones
There is a scientific difference between noise and pure musical tones.
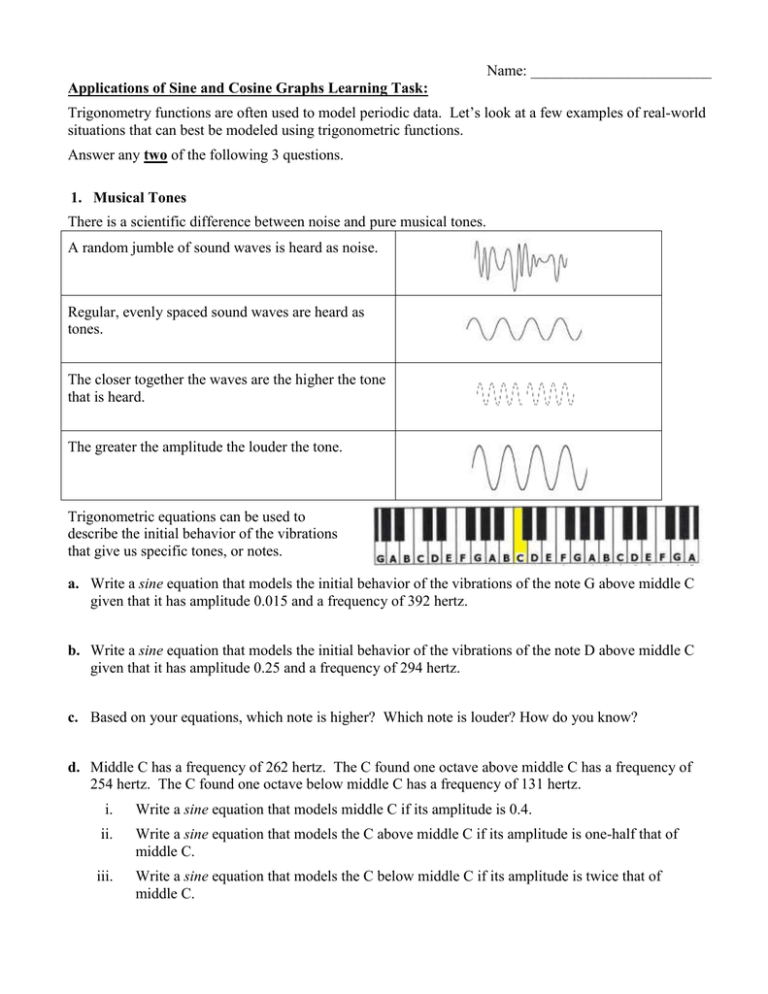
A random jumble of sound waves is heard as noise.
Regular, evenly spaced sound waves are heard as
tones.
The closer together the waves are the higher the tone
that is heard.
The greater the amplitude the louder the tone.
Trigonometric equations can be used to
describe the initial behavior of the vibrations
that give us specific tones, or notes.
a. Write a sine equation that models the initial behavior of the vibrations of the note G above middle C
given that it has amplitude 0.015 and a frequency of 392 hertz.
b. Write a sine equation that models the initial behavior of the vibrations of the note D above middle C
given that it has amplitude 0.25 and a frequency of 294 hertz.
c. Based on your equations, which note is higher? Which note is louder? How do you know?
d. Middle C has a frequency of 262 hertz. The C found one octave above middle C has a frequency of
254 hertz. The C found one octave below middle C has a frequency of 131 hertz.
i.
Write a sine equation that models middle C if its amplitude is 0.4.
ii.
Write a sine equation that models the C above middle C if its amplitude is one-half that of
middle C.
iii.
Write a sine equation that models the C below middle C if its amplitude is twice that of
middle C.
Accelerated Mathematics III
Unit 5
1st Edition
2. The Ferris Wheel
There are many rides at the amusement park whose movement can be described using trigonometric
functions. The Ferris Wheel is a good example of periodic movement.
Sydney wants to ride a Ferris wheel that has a radius of 60 feet
and is suspended 10 feet above the ground. The wheel rotates at
a rate of 2 revolutions every 6 minutes. (Don’t worry about the
distance the seat is hanging from the bar.) Let the center of the
wheel represents the origin of the axes.
a. Write a function that describes a Sydney’s height above the
ground as a function of the number of seconds since she was
¼ of the way around the circle (at the 3 o’clock position).
b. How high is Sydney after 1.25 minutes?
c. Sydney’s friend got on after Sydney had been on the Ferris
wheel long enough to move a quarter of the way around the
circle. How would a graph of her friend’s ride compare to the
graph of Sydney’s ride? What would the equation for Sydney’s friend be?
3. Weather Models
A city averages 14 hours of daylight in June, 10 in December, and 12 in both March and September.
Assume that the number of hours of daylight varies periodically from January to December. Write a cosine
function, in terms of t, that models the hours of daylight. Let t = 0 correspond to the month of January.
Georgia Department of Education, State Superintendent of Schools
June, 2011, Copyright 2010 © All Rights Reserved
Unit 5: Page 2 of 4
Accelerated Mathematics III
Unit 5
1st Edition
Notes on Applications of Sine and Cosine Graphs Learning Task
Supplies:
Graphing calculators or a graphing utility on a computer
*Globe
Poster putty
String
*Copy of a world map
Colored pencils or pens
Grid paper
Ruler
*You may be able to borrow these items from your Social Studies department.
Notes:
This task is designed to give students a chance to model different types of real-world problems using sine
and cosine graphs. Students will have an opportunity to apply the concepts they investigated in the previous
task.
Each of these problems introduces a topic that can be further investigated by students in greater detail.
There are multiple resources related to each topic that can be easily found on the internet. This could lead
into a project allowing students to investigate a topic they find of interest.
Applications of Sine and Cosine Graphs Learning Task
Trigonometry functions are often used to model periodic data. Let’s look at a few examples of real-world
situations that can best be modeled using trigonometric functions.
1. The Flight of the Space Shuttle
As mathematicians in the US space program, you and your team have been assigned the task of determining
the first orbit of the Space Shuttle on the next mission. Your project is to determine the orbit of the shuttle
and any other information which might affect the remainder of the orbits during the remainder of this flight.
(Will all orbits cross over the same initial points? Explain why or why not. )
Some points to remember are the shuttle may not cross land on the initial lift-off and the shuttle will launch
from Kennedy Space Center in Florida.
Materials which may be used to complete this project include:
Globe
Poster putty
String
Copy of a world map
Colored pencils or pens
Grid paper
Ruler
Georgia Department of Education, State Superintendent of Schools
June, 2011, Copyright 2010 © All Rights Reserved
Unit 5: Page 3 of 4
Accelerated Mathematics III
Unit 5
1st Edition
To begin your project:
4. Use the string to measure the circumference of a “great circle” by measuring the circumference of
the globe at the equator.
5. Beginning at Kennedy Space Center, use your string to mark a great circle which represents your
proposed orbit. Your orbit should alternate north and south of the equator. Hold the string in place
around the globe with the poster putty.
6. Plot the coordinates of the orbit as ordered pairs (longitude, latitude) on a flat map of the globe.
7. Plot the coordinates of your orbit on graph paper. Use the intersection fo the equator and the prime
meridian as your origin.
Find a sinusoidal (sine) equation to fit your data. Include your coordinates for the orbit and show how you
determined the equation of the orbit.
You may use a graphing calculator to check your work.
Georgia Department of Education, State Superintendent of Schools
June, 2011, Copyright 2010 © All Rights Reserved
Unit 5: Page 4 of 4
Accelerated Mathematics III
Unit 5
Georgia Department of Education, State Superintendent of Schools
June, 2011, Copyright 2010 © All Rights Reserved
Unit 5: Page 5 of 4
1st Edition
Accelerated Mathematics III
Unit 5
1st Edition
Possible Solution*:
One
Georgia Department of Education, State Superintendent of Schools
June, 2011, Copyright 2010 © All Rights Reserved
Unit 5: Page 6 of 4
Accelerated Mathematics III
Unit 5
1st Edition
*Courtesy of Nancy Benson.
2. Musical Tones
There is a scientific difference between noise and pure musical tones.
A random jumble of sound waves is heard as noise.
Regular, evenly spaced sound waves are heard as
tones.
The closer together the waves are the higher the tone
that is heard.
The greater the amplitude the louder the tone.
Trigonometric equations can be used to
describe the initial behavior of the vibrations
that give us specific tones, or notes.
e. Write a sine equation that models the initial behavior of the vibrations of the note G above middle C
given that it has amplitude 0.015 and a frequency of 392 hertz.
The frequency and period are reciprocals of each other so the period = .
Since the
, we can solve for k.
If
, then k =
.
Since the amplitude is 0.015, A = 0.015.
F(x) =0.015 sin
f. Write a sine equation that models the initial behavior of the vibrations of the note D above middle C
given that it has amplitude 0.25 and a frequency of 294 hertz.
The frequency and period are reciprocals of each other so the period = .
Since the
, we can solve for k.
If
, then k =
.
Since the amplitude is 0.25, A = 0.25.
F(x) =0.25 sin
g. Based on your equations, which note is higher? Which note is louder? How do you know?
The smaller the period the closer together the notes are. So the G will be louder because it has a
smaller period.
The D is louder because it has a bigger amplitude.
Georgia Department of Education, State Superintendent of Schools
June, 2011, Copyright 2010 © All Rights Reserved
Unit 5: Page 7 of 4
Accelerated Mathematics III
1st Edition
Unit 5
h. Middle C has a frequency of 262 hertz. The C found one octave above middle C has a frequency of 254
hertz. The C found one octave below middle C has a frequency of 131 hertz.
iv.
Write a sin equation that models middle C if its amplitude is 0.4.
The frequency of middle C is 262 hertz so the period = .
Since the
, we can solve for k.
If
, then k =
.
Since the amplitude is 0.5, A = 0.4.
F(x) =0.4 sin
v.
Write a sine equation that models the C above middle C if its amplitude is one-half that of
middle C.
The frequency of middle C is 254 hertz so the period =
.
Since the
, we can solve for k.
If
, then k =
.
Since the amplitude is 0.5(0.5), A = 0.25.
F(x) =0.25 sin
vi.
Write a sine equation that models the C below middle C if its amplitude is twice that of middle
C.
The frequency of middle C is 131 hertz so the period =
Since the
.
, we can solve for k.
If
, then k =
.
Since the amplitude is 2(0.5), A = 0.4.
F(x) = sin
Georgia Department of Education, State Superintendent of Schools
June, 2011, Copyright 2010 © All Rights Reserved
Unit 5: Page 8 of 4
Accelerated Mathematics III
Unit 5
1st Edition
3. The Ferris Wheel
There are many rides at the amusement park whose movement can be described using trigonometric
functions. The Ferris Wheel is a good example of periodic movement.
Sydney wants to ride a Ferris wheel that has a radius of 60 feet
and is suspended 10 feet above the ground. The wheel rotates at
a rate of 2 revolutions every 6 minutes. (Don’t worry about the
distance the seat is hanging from the bar.) Let the center of the
wheel represents the origin of the axes.
d. Write a function that describes a Sydney’s height above the
ground as a function of the number of seconds since she was
¼ of the way around the circle (at the 3 o’clock position).
Comment:
If you want to scaffold your students through this process you
can give them this series of questions to guide their thinking.
Encourage students to make a sketch of the graph based on
the movement of the Ferris wheel before they start trying to
create an equation.
What is the period of the function?
2 revolutions every 6 minutes means one complete revolution every 3 minutes, so the period is 3
minutes.
Since the
, we can solve for k.
If
, then k = .
What is the maximum height?
The maximum height is 10 + 60 + 60 = 130 feet
What is the minimum height?
The minimum height is 10 feet
What is the midline of the function?
The midline is the average of the max and min height. The midline is at y=70 feet.
What is the amplitude of the function?
The amplitude is ½ the distance between the max and min.
The amplitude is (130-10)/2=60.
F(t) = 60 sin
+ 70
e. How high is Sydney after 1.25 minutes?
F(t) = 60 sin
+ 70= 100
Sydney is 100 feet above the ground.
Georgia Department of Education, State Superintendent of Schools
June, 2011, Copyright 2010 © All Rights Reserved
Unit 5: Page 9 of 4
Accelerated Mathematics III
Unit 5
1st Edition
f. Sydney’s friend got on after Sydney had been on the Ferris wheel long enough to move a quarter of the
way around the circle. How would a graph of her friend’s ride compare to the graph of Sydney’s ride?
What would the equation for Sydney’s friend be?
The graph would be shifted to the right by a quarter of the period.
So F(t) = 60 sin
+ 70
4. Weather Models
A city averages 14 hours of daylight in June, 10 in December, and 12 in both March and September.
Assume that the number of hours of daylight varies periodically from January to December. Write a cosine
function, in terms of t, that models the hours of daylight. Let t = 0 correspond to the month of January.
The period of the function is 12 months.
Since the
, we can solve for k.
If
, then k = .
The maximum hours of daylight is 14 hours per day in June.
The minimum hours of daylight is 10 hours per day in December. Based on our other data we can also
deduct the minimum number also occurs in January.
The midline is y = 12 hours.
The amplitude is 2 hours.
If you look at a sketch of the graph, the maximum occurs at June, t=5. Typically on a cos graph the
maximum occurs at t=0. So there has been a phase shift of 5 in this problem.
Phase shift =
.
implies that c=
The final equation is: f(t)=
Georgia Department of Education, State Superintendent of Schools
June, 2011, Copyright 2010 © All Rights Reserved
Unit 5: Page 10 of 4

