Stage 1 - Teachers in Industry
Andy Jeanson
Stage 1
1
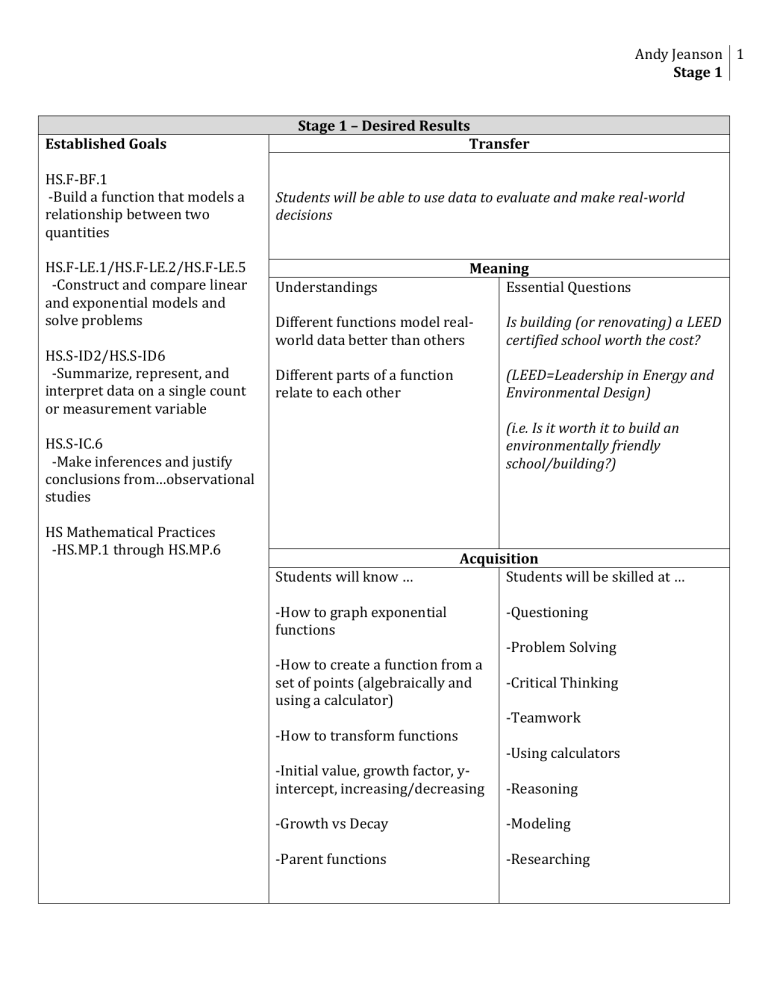
Established Goals
HS.F-BF.1
-Build a function that models a relationship between two quantities
HS.F-LE.1/HS.F-LE.2/HS.F-LE.5
-Construct and compare linear and exponential models and solve problems
HS.S-ID2/HS.S-ID6
-Summarize, represent, and interpret data on a single count or measurement variable
HS.S-IC.6
-Make inferences and justify conclusions from…observational studies
HS Mathematical Practices
-HS.MP.1 through HS.MP.6
Stage 1 – Desired Results
Students will be able to use data to evaluate and make real-world decisions
Understandings
Different functions model realworld data better than others
Different parts of a function relate to each other
Transfer
Meaning
Essential Questions
Is building (or renovating) a LEED certified school worth the cost?
(LEED=Leadership in Energy and
Environmental Design)
(i.e. Is it worth it to build an environmentally friendly school/building?)
Acquisition
Students will know …
-How to graph exponential functions
-How to create a function from a set of points (algebraically and using a calculator)
Students will be skilled at …
-Questioning
-Problem Solving
-Critical Thinking
-How to transform functions
-Initial value, growth factor, yintercept, increasing/decreasing
-Growth vs Decay
-Parent functions
-Teamwork
-Using calculators
-Reasoning
-Modeling
-Researching
2
Stage 2 - Assessments
Performance Task
-Since CVHS desires to have a high level of recognition, the principal wants to decide if it is worth the cost to create a more environmentally friendly school. As project engineers (R), your task is to present a design renovation to the principal (A) that will upgrade Campo
Verde High School to a LEED certified school, at the cheapest cost possible based on the ratings from http://www.usgbc.org/leed/rating-systems/schools (G). You must decide if improving a school to be LEED certified is worth the cost (A). Your presentation (P) will be judged on the validity of the math presented (S) when coming to your decision while weighting the costs and benefits. Graphs and charts should be included to show the cost analysis of implementing environmental upgrades.
Other Evidence: (quizzes, tests, prompts, work samples, labs, etc.)
-Weekly group updates with progress towards project/rubric
-2 quizzes (1-graphing, rewriting, 2-solving equations)
-1 unit test on exponential functions including solving, graphing, and transformations
-Final group presentation
-Prompt: Explain why it is harder for a building to be LEED Platinum (80+ point) than
Gold (60-79).
*Relate your answer to the math in this unit [answer(s): the costs rise exponentially
for the hardest requirements].
Student Self-Assessment and Reflection
-Rubric given to students at beginning of unit used to evaluate progress towards learning the necessary math required for assessing cost analysis
-KWL (at beginning)
-Concept Map (start in the middle of the unit, then finish before test)
-Reflect on the difference between your group’s graph and that of another (in terms of transformations).
-Reflect on whether being LEED certified is worth the cost (*must use math)
Andy Jeanson
Stage 1
3
Stage 3 – Learning Plan
W:
Students will begin the exponential and logarithmic functions unit by looking at the performance task (this gets at a main idea: how can we use data to model real world situations):
Since CVHS desires to be recognized, the principal wants to look into deciding if it is worth the cost to create a more environmentally friendly school. As project engineers (R), your task is to present a design renovation to the principal (A) that will upgrade Campo Verde High School to a LEED certified school, at the cheapest cost possible based on the ratings from http://www.usgbc.org/leed/ratingsystems/schools (G). You must decide if improving a school to be LEED certified is worth the cost (A). Your presentation (P) will be judged on the validity of the math presented (S) when coming to your decision while weighting the costs and benefits.
Graphs, charts, and an applicable function should be included to show the cost analysis of implementing environmental upgrades.
In addition to the performance task, students will be given a quiz on graphing exponential and logarithmic functions, and a quiz on solving equations. They will have a prompt that asks them to explain why it is harder for a building to be LEED
Platinum than Gold (costs rise exponentially) using math as the basis for their answer. Once groups have created a function to model the costs associated with the performance task, students from different groups will partner up and discuss transformations between each of their functions. At the end of the unit, students will take a unit test incorporating everything they learned in the unit.
A KWL chart will be completed by each group after the performance tasks is given.
H: As project engineers, your task is to present a design renovation to the principal that will upgrade Campo Verde High School to a LEED certified school, at the cheapest cost possible.
Students will brainstorm why companies would create environmentally friendly and
LEED certified buildings and why would a school want to be LEED certified.
Video about 1 st HS Gold LEED Certified: https://www.youtube.com/watch?v=vJn8Tj5dKAk
Video of Sundt sustainability (where I worked this summer) https://www.youtube.com/watch?v=m1t2GIMH4WA
E:
Beginning of unit: Performance task given; students will be required to research
LEED certifications for schools to understand how points are allocated based on certain environmental factors. Students will be allowed to walk around campus and find any parts of the school that CVHS would already get points for. The school custodian will then come in and discuss the elements of the school that are environmentally friendly. Using this information, students will determine the cost to earn points for improving our school. The costs with relation to points will be graphed and students must write a function that models the costs. Transformations
Pre-Assessments
What pre-assessments will you use to check student’s prior knowledge, skill levels, and potential misconceptions?
-Class discussion about different types of functions
-KWL
Progress Monitoring
• How will you monitor students’ progress toward acquisition, meaning, and transfer, during lesson events?
HW, Weekly Project progress paragraph(s) ,
Quizzes, Concept
Map
• What are potential rough spots and student misunderstandings?
-Choosing most applicable function for graphs.
Transformations of graphs from one group to another
• How will students get the feedback they need
Direct teacher feedback, quizzes, graded homework, reflection paragraphs on project progress, peer feedback using cooperative grouping
4 will be introduced by partnering students up from different groups and comparing their graphs/functions.
*Students will be shown how to find exponential regressions on TI-83/TI-84 calculators.
Middle of unit: Students will take notes on logarithmic functions. As a class, we will discuss how they may or may not be relevant to costs for the performance task (i.e. some functions model data better than others).
End of unit: Students will take notes on solving equations. (Since this unit is second semester and my first time teaching the honors curriculum, I haven’t gotten that far ahead to create any activities that will relate this part to the project.)
R: Using the graphs that groups create, we will discuss how to write a function and which functions are most applicable. Individual students will compare the cost graphs of one other group. They will analyze how the graphs are different from each other in order to explore transformations. Students will constantly update their concept map. Students will get feedback when they turn in weekly project reflections.
E: Students will update their concept maps. The weekly project reflections will relate what they’ve done with their project with the math they learned. There will be daily wrap-ups where students discuss what they’ve learned. Students will self-assess their project.
T: Introduce essential question and have students reflect on how the math fits with it. The KWL chart will be created by the class. Students create concept maps showing the math that was learned in the unit. Students work in pairs to discuss transformations. There will be a group discussion about the relevance of logarithmic functions and costs. The final project is presented.
O: The unit is set up where students are introduced to what an exponential function looks like and what an exponential function might look like ( y
= ab x ). Students will learn how to write exponential functions and then how to represent transformations.
Logarithmic functions are introduced next, followed by solving exponential and logarithmic equations.
•
Are all three types of goals (acquisition, meaning, and transfer) addressed in the learning plan?
Students will acquire knowledge of exponential functions and how to write them
Students will transfer knowledge of writing, graphing and transformations of quadratic functions to exponential functions
Students will discover what exponential functions look like, attempt to write exponential functions from graphs
•
Does the learning plan reflect principles of learning and best practices?
Students will be active in the learning process; they will work collaboratively and hopefully learn through inquiry (with scaffolding).
•
Is there tight alignment with Stages 1 and 2?
Yes
•
Is the plan likely to be engaging and effective for all students?
Hopefully students will be engaged since everything ties together into the project. Students will be able to work in groups and be responsible for each member’s learning. Students will each be required to monitor their own progress and demonstrate competency.
Andy Jeanson
Stage 1
APPENDIX 1
I first came up with the beginning idea for this project when all the new employees were given a tour of the Sundt Construction headquarters building in Tempe. The tour was given by a guy who worked in the sustainability department. One employee asked if they used solar panels on the roof. The guy giving the tour said that in this heat, the solar panels burn out or get damaged so quickly that the replacement cost is not worth the added benefit (although I’m not sure this is true). Later on in my internship, I noticed that on the company’s website, anytime a constructed building gets LEED certified (i.e. economically friendly), there is a big deal made about it.
I started researching LEED certification and realized they had a report that is just for schools. As I was looking through the packet that explains how points are allocated for certain features, I noticed that some aspects are worth more points than others. The cost it would take to get these points are much higher than aspects only worth 1 point. I also knew our school tries to be as green as possible. In the entrance to our administration building, there is a window case that explains how the solar panels on our school’s roof works and the cost savings benefit. By examining this performance task, students may be able to implement small programs that have little to no cost, which would make our school more environmentally friendly.
5
6
APPENDIX 2
Technology:
-Students will use TI-84 graphing calculators.
-Students will use their own smartphone, ipad, laptop to do research
Resources:
-The school custodian will discuss aspects of the school that make it environmentally friendly.
-Students may be able to see the school’s solar panels
-Website for LEED certification for schools http://www.usgbc.org/leed/rating-systems/schools
-2 Youtube videos: https://www.youtube.com/watch?v=vJn8Tj5dKAk https://www.youtube.com/watch?v=m1t2GIMH4WA
