PreCalculus Chapter 1: Functions and Graphs Syllabus
advertisement
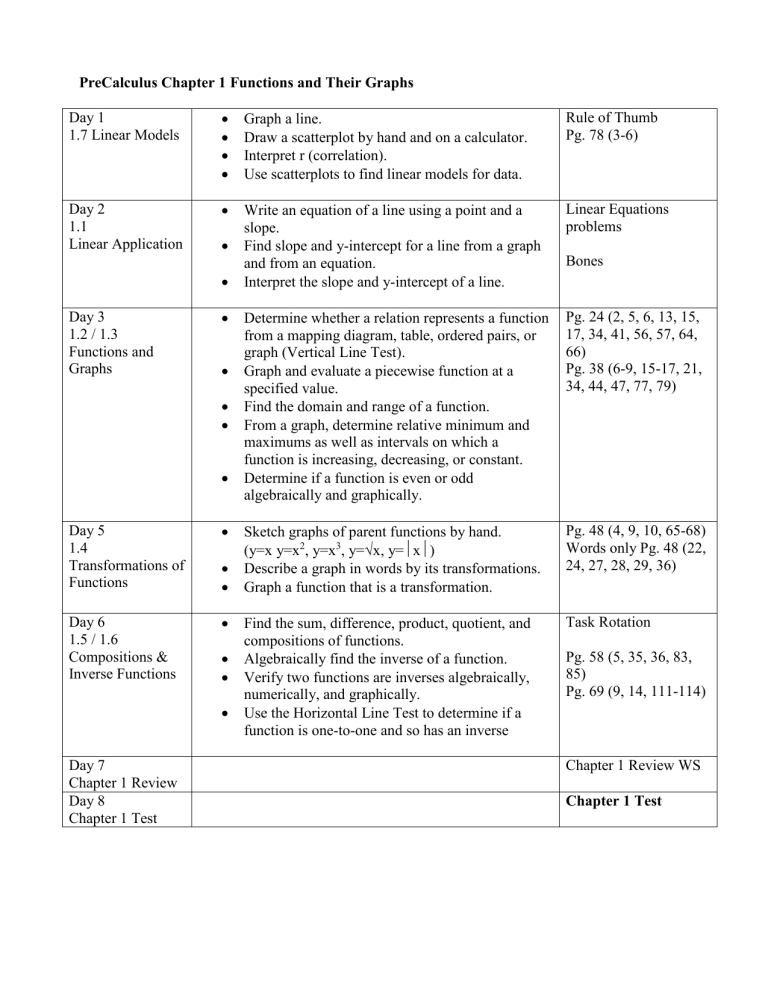
PreCalculus Chapter 1 Functions and Their Graphs Day 1 1.7 Linear Models Graph a line. Draw a scatterplot by hand and on a calculator. Interpret r (correlation). Use scatterplots to find linear models for data. Rule of Thumb Pg. 78 (3-6) Day 2 1.1 Linear Application Write an equation of a line using a point and a slope. Find slope and y-intercept for a line from a graph and from an equation. Interpret the slope and y-intercept of a line. Linear Equations problems Determine whether a relation represents a function from a mapping diagram, table, ordered pairs, or graph (Vertical Line Test). Graph and evaluate a piecewise function at a specified value. Find the domain and range of a function. From a graph, determine relative minimum and maximums as well as intervals on which a function is increasing, decreasing, or constant. Determine if a function is even or odd algebraically and graphically. Pg. 24 (2, 5, 6, 13, 15, 17, 34, 41, 56, 57, 64, 66) Pg. 38 (6-9, 15-17, 21, 34, 44, 47, 77, 79) Sketch graphs of parent functions by hand. (y=x y=x2, y=x3, y=x, y=x) Describe a graph in words by its transformations. Graph a function that is a transformation. Pg. 48 (4, 9, 10, 65-68) Words only Pg. 48 (22, 24, 27, 28, 29, 36) Find the sum, difference, product, quotient, and compositions of functions. Algebraically find the inverse of a function. Verify two functions are inverses algebraically, numerically, and graphically. Use the Horizontal Line Test to determine if a function is one-to-one and so has an inverse Task Rotation Day 3 1.2 / 1.3 Functions and Graphs Day 5 1.4 Transformations of Functions Day 6 1.5 / 1.6 Compositions & Inverse Functions Day 7 Chapter 1 Review Day 8 Chapter 1 Test Bones Pg. 58 (5, 35, 36, 83, 85) Pg. 69 (9, 14, 111-114) Chapter 1 Review WS Chapter 1 Test 1.7 Linear Models Graph a line. Draw a scatterplot by hand and on a calculator. Interpret r (correlation). Use scatterplots to find linear models for data. 1.1 Linear Application Write an equation of a line using a point and a slope. Find slope and yintercept for a line from a graph and from an equation. Interpret the slope and y-intercept of a line. 1.2/1.3 Functions Determine whether a relation represents a function from a mapping diagram, table, ordered pairs, or graph (Vertical Line Test). Graph and evaluate a piecewise function at a specified value. Find the domain and range of a function. From a graph, determine relative minimum and maximums as well as intervals on which a function is increasing, decreasing, or constant. Determine if a function is even or odd 1.4 Transformations Sketch graphs of parent functions by hand. 2 3 (y=x y=x , y=x , y=x, y=x) Describe a graph in words by its transformations. Graph a function that is a transformation. 1.5/1.6 Compositions and Inverses Find the sum, difference, product, quotient, and compositions of functions. Algebraically find the inverse of a function. Verify two functions are inverses algebraically, numerically, and graphically. Use the Horizontal Line Test to determine if a function is one-toone and so has an inverse
