free sample here
advertisement

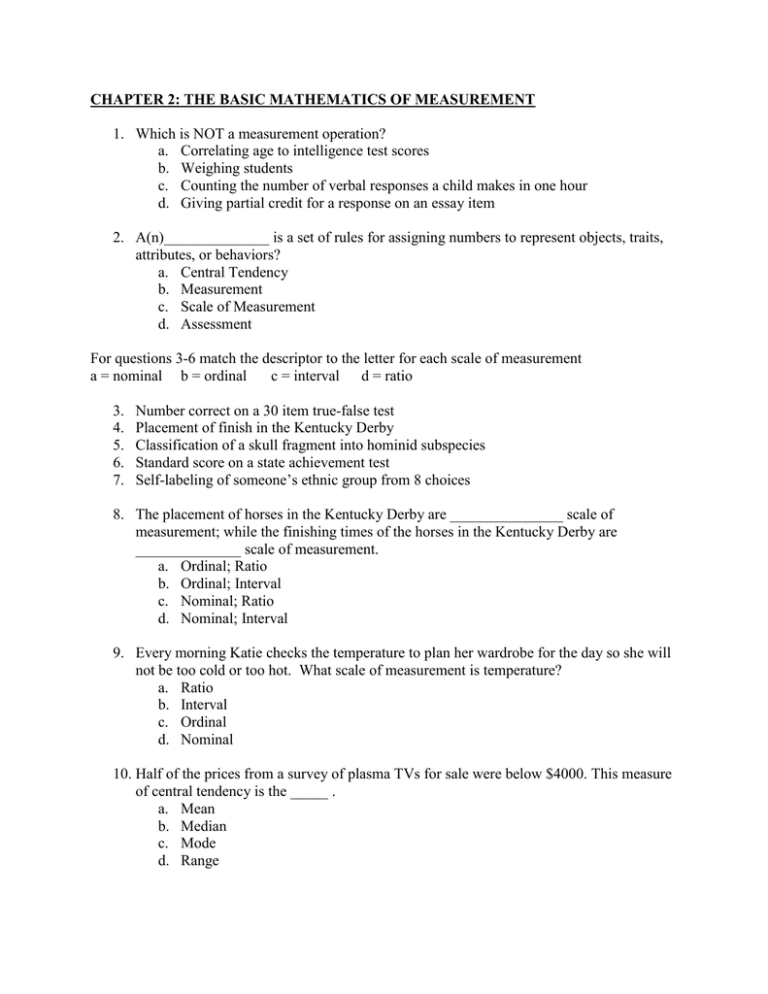
CHAPTER 2: THE BASIC MATHEMATICS OF MEASUREMENT 1. Which is NOT a measurement operation? a. Correlating age to intelligence test scores b. Weighing students c. Counting the number of verbal responses a child makes in one hour d. Giving partial credit for a response on an essay item 2. A(n)______________ is a set of rules for assigning numbers to represent objects, traits, attributes, or behaviors? a. Central Tendency b. Measurement c. Scale of Measurement d. Assessment For questions 3-6 match the descriptor to the letter for each scale of measurement a = nominal b = ordinal c = interval d = ratio 3. 4. 5. 6. 7. Number correct on a 30 item true-false test Placement of finish in the Kentucky Derby Classification of a skull fragment into hominid subspecies Standard score on a state achievement test Self-labeling of someone’s ethnic group from 8 choices 8. The placement of horses in the Kentucky Derby are _______________ scale of measurement; while the finishing times of the horses in the Kentucky Derby are ______________ scale of measurement. a. Ordinal; Ratio b. Ordinal; Interval c. Nominal; Ratio d. Nominal; Interval 9. Every morning Katie checks the temperature to plan her wardrobe for the day so she will not be too cold or too hot. What scale of measurement is temperature? a. Ratio b. Interval c. Ordinal d. Nominal 10. Half of the prices from a survey of plasma TVs for sale were below $4000. This measure of central tendency is the _____ . a. Mean b. Median c. Mode d. Range 11. Last year the basketball concession stand sold five different types of candy bars, and this year is only purchasing one type of candy bar to sell. What central tendency should be used to decide which candy bar from last year to purchase? a. Mean b. Median c. Mode d. Range 12. Why is the median a better indicator of central tendency for skewed data sets than the mean or mode? a. The mean over-corrects for variation. b. The mode will look too large. c. The median will not be as affected by the skewing. d. The mean will always be larger than the median. 13. If your distribution is skewed, which central tendency is most appropriate? a. Mean b. Mode c. Median d. Average 14. Which statement is correct for selection of the median or mean as a measure of central tendency for skewed data sets ? a. The mean over-corrects for variation b. The median is always too small. c. The median will be unaffected by the skewing. d. The mean will always be larger than the median. 15. What is a descriptor for a set of scores grouped together by frequency? a. Scatter b. List c. Table d. Distribution 16. A bimodal distribution is best described as a. a distribution with two scores that are the same. b. a distribution with two scores of the same and greatest frequency. c. a distribution with two scores of the same frequency. d. a distribution with two scores of the same and lowest frequency. 17. In a positively skewed distribution, the ____________ will be greater than the ______________? a. Mode; Median. b. Median; Mean c. Mode; Mean d. Mean; Median 18. In a negatively skewed distribution, the ____________ will be greater than the ______________? a. Median; Mean b. Mean; Median c. Median; Mode d. Mean; Mode 19. What is the range of the data below? 8 10 12 14 16 18 20 22 a. b. c. d. 8 14 15 22 20. What measure of central tendency must you be able to first calculate in order to calculate a standard deviation? a. Mean b. Median c. Mode d. Range 21. The standard deviation can be interpreted as measuring: a. the average distance that scores vary from the mean of the distribution. b. the greatest distance that scores vary from the mean of the distribution. c. the average percentage of the distance that the scores vary from the mean of the distribution. d. the percentage of the distance that half the scores vary from the mean of the distribution. 22. Why would a researcher use the standard deviation instead of the variance to explain the results of a study? a. The standard deviation is smaller than the variance. b. The variance is too large a number for easy interpretation. c. The standard deviation is the same scale as the observed scores. d. The variance gives only the variability of the mean. 23. Why is the variance preferred over the range or semi-interquartile range? a. The variance is always smaller than range measures. b. The variance has better mathematical properties. c. The range measures don’t account for extreme scores properly. d. The range measures are more accurate than reliable. 24. A small correlation is sometimes defined as a value between +.25 and -.25, and is best described as indicating a. a small proportion of variation in one variable is associated with the other’s variation. b. less than one fourth of the cases in one variable are related to cases in the other. c. scores on one variable are less than one-fourth as large as scores on the other.] d. all scores on one variable are within one-quarter standard deviation of scores on the other variable. 25. A zero correlation between x and y means a. All scores on y have the same value for any value of x. b. All scores on y are the same (i.e. there is no variation of the y scores). c. The mean of y scores for one value of x is about the same as for another value of x d. The means for y and x values are the same. 26. A correlation of .6 and correlation of -.6 relating age and test score are alike in what way? a. The same precision of prediction occurs. b. The extreme scores will regress upward in both cases. c. The regression equation will be the same for both. d. The smallest scores on age show the least variation from the mean on both. 27. A _________ will generally show the direction of the relationship between two variables. a. box plot b. distribution plot c. frequency plot d. scatter plot 28. Which of the following is(are) a measure(s) of variability? a. Range b. Standard deviation c. Variance d. All of the above 29. If the standard deviation is given as the Greek symbol sigma (σ), what do you know about the data set? a. It is a population b. It is a sample c. It is using a different scale of measurement d. It is referring to the variance 30. In what situation will the variance NOT be greater than the standard deviation? a. The standard deviation is 0 . b. The standard deviation is .5 . c. The standard deviation is 1.0 . d. The standard deviation is never larger than the variance 31. When the variability of a set of 10 scores is increased what happens to the distribution? a. The distribution gets flatter and wider. b. The distribution gets narrower and taller. c. The distribution is not influenced by the variability. d. There is not enough information to determine what happens. 32. What does the magnitude of the correlation coefficient between two variables refer to? a. The direction of the relationship between two variables b. The linearity of the relationship between two variables c. The strength of association of the correlation d. Whether the correlation coefficient is negative or positive 33. A scatter plot generally shows the __________ of the relationship between two variables. a. strength b. direction c. magnitude d. variability 34. What is an appropriate interpretation of the correlation coefficient? a. To predict performance of one variable based on the performance of another variable b. To establish causality of one variable based on the performance of another variable c. To standardize performance ability of one variable based on the performance of another variable d. To standardize causality of one variable based on the performance of another variable 35. A linear regression line is represented by y= ax + b, where y = Reading and x = Age in years. Which statement is correct: a. If a = 3 then Reading scores are equal to three times age. b. If a = 3 then Reading score increases 3 points for a 1 year age increase. c. If a = 3 then Reading scores are three times as likely to increase with age as decrease. d. If a = 3 then there are three Reading scores that students at each age can receive. For questions 36-40 match the description of relationship to the appropriate correlation coefficient: a = Pearson b = point biserial c = phi coefficient d = Spearman correlation 36. Relate gender to state test score. 37. Relate order of finish on a spelling bee to class rank. 38. Relate age to weight. 39. Relate learning disability status (LD or NLD) to gender. 40. Relate passing the state test (Pass-Fail) to family income in dollars. 41. The correlation between economic conditions and fashion (conservative or liberal) has been estimated at upwards of .6 over the last 300 years in Europe and the Americas. This means a. Changing fashion can improve economic conditions. b. A stock market crash will produce different fashions. c. Both economies and fashion trends are related to other variables d. None of the above- it is random. Answer Key 1. a 2. b 3. d 14. c 15. d 16. b 27. d 28. d 29. a 40. b 41. c 4. b 17. d 30. b 5. a 18. a 31. a 6. c 19. b 32. c 7. a 20. a 33. b 8. a 21. a 34. a 9. b 10. b 22. c 23. b 35. b 36. b 11. c 24. a 37. d 12. c 25. c 38. a 13. c 26. a 39. c


