Analyzing the Heart with EKGrevised
advertisement
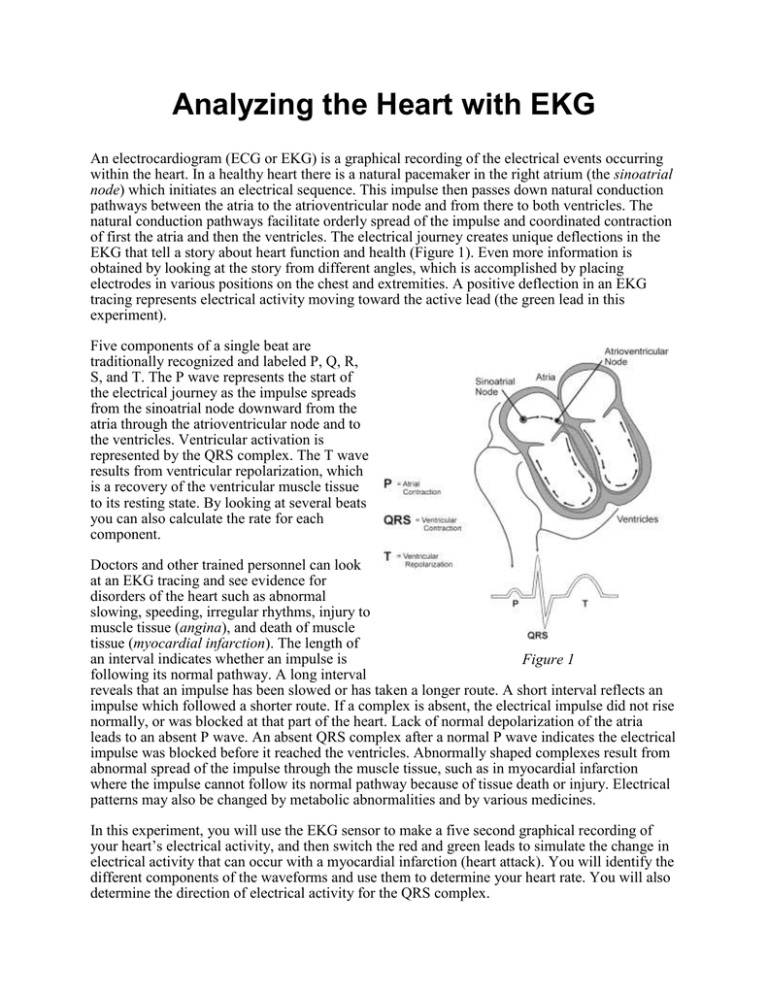
Analyzing the Heart with EKG An electrocardiogram (ECG or EKG) is a graphical recording of the electrical events occurring within the heart. In a healthy heart there is a natural pacemaker in the right atrium (the sinoatrial node) which initiates an electrical sequence. This impulse then passes down natural conduction pathways between the atria to the atrioventricular node and from there to both ventricles. The natural conduction pathways facilitate orderly spread of the impulse and coordinated contraction of first the atria and then the ventricles. The electrical journey creates unique deflections in the EKG that tell a story about heart function and health (Figure 1). Even more information is obtained by looking at the story from different angles, which is accomplished by placing electrodes in various positions on the chest and extremities. A positive deflection in an EKG tracing represents electrical activity moving toward the active lead (the green lead in this experiment). Five components of a single beat are traditionally recognized and labeled P, Q, R, S, and T. The P wave represents the start of the electrical journey as the impulse spreads from the sinoatrial node downward from the atria through the atrioventricular node and to the ventricles. Ventricular activation is represented by the QRS complex. The T wave results from ventricular repolarization, which is a recovery of the ventricular muscle tissue to its resting state. By looking at several beats you can also calculate the rate for each component. Doctors and other trained personnel can look at an EKG tracing and see evidence for disorders of the heart such as abnormal slowing, speeding, irregular rhythms, injury to muscle tissue (angina), and death of muscle tissue (myocardial infarction). The length of an interval indicates whether an impulse is Figure 1 following its normal pathway. A long interval reveals that an impulse has been slowed or has taken a longer route. A short interval reflects an impulse which followed a shorter route. If a complex is absent, the electrical impulse did not rise normally, or was blocked at that part of the heart. Lack of normal depolarization of the atria leads to an absent P wave. An absent QRS complex after a normal P wave indicates the electrical impulse was blocked before it reached the ventricles. Abnormally shaped complexes result from abnormal spread of the impulse through the muscle tissue, such as in myocardial infarction where the impulse cannot follow its normal pathway because of tissue death or injury. Electrical patterns may also be changed by metabolic abnormalities and by various medicines. In this experiment, you will use the EKG sensor to make a five second graphical recording of your heart’s electrical activity, and then switch the red and green leads to simulate the change in electrical activity that can occur with a myocardial infarction (heart attack). You will identify the different components of the waveforms and use them to determine your heart rate. You will also determine the direction of electrical activity for the QRS complex. Objectives In this experiment, you will Obtain graphical representation of the electrical activity of the heart over a period of time. Learn to recognize the different wave forms seen in an EKG, and associate these wave forms with activity of the heart. Determine the heart rate by determining the rate of individual wave forms in the EKG. Compare wave forms generated by alternate EKG lead placements. MATERIALS Computer (turned on) LabQuest mini interface box with USB cable LoggerPro 3.8.4 Software Vernier EKG Sensor Electrode tabs PROCEDURE: PART I STANDARD LIMB LEAD EKG 1. 2. 3. 4. 5. 6. 7. 8. Turn on & log onto the computer. Plug LabQuest Mini into the computer (into a USB port on the front of the computer) Connect the EKG Sensor to the LabQuest Mini. On computer, click on “Logger Pro 3.8.4” icon. Choose File, Open, Human Physiology with Vernier, 12. Analyzing Heart With EkG. Attach three electrode tabs to your arms, as shown in Figure 2, by placing a single patch on the inside of the right wrist, on the inside of the right upper forearm (distal to the elbow), and on the inside of the left upper forearm (distal to elbow). Connect the EKG clips to the electrode tabs as shown in Figure 2. Sit in a relaxed position in a chair, with your forearms resting on your legs or on the arms of the chair. When you are properly positioned, have someone at the computer click “experiment”, then “start collection”. OPTIONAL: You can print a copy if you like, but it will cost you $.50/page Once data collection is finished, use click-and-drag to highlight each interval listed in Table 1. Use Figure 3 as your guide when determining these intervals. Enter the ^t value of each highlighted area to the nearest 0.01 second in Table 1. This value can be found in the lower left corner of the graph. See Table 2 for expected intervals. 9. Calculate the heart rate in beats/min using the EKG data. Record the heart rate to the nearest whole number in Table 1. 10. Store this run by tapping the File cabinet icon. 11. Repeat these same measurements after doing 5 minutes of moderate exercise and record them Figure 2 on Table 1. P-R interval: QRS complex: Figure 3 time from the beginning of P wave to the start of the QRS complex. This represents the time for the signal to travel from the SA node, through the ventricles and through the AV node. time from Q deflection to S deflection. This is the electrical signal traveling through the ventricles. (Why is it larger than the P wave?) Q-T interval: time from Q deflection to the end of the T. This is the approximate duration of systole. Which interval represents the time of Diastole?(not one of the above)______ DATA Table 1 Interval P–R QRS Q–T R–R Heart Rate (bpm) = 60sec./minute divided by R-R Resting (secs.) After Exercise (secs.) Increase or Decrease? Table 2 Normal Ranges Standard Resting Electrocardiogram Interval Times P–R interval 0.12 to 0.20 s QRS interval less than 0.12 s Q–T interval 0.30 to 0.40 s Part II Alternate limb lead EKG 8. Exchange the red and green EKG clips so that the green clip is now attached to the electrode tab on the left arm and the red clip is on the right arm. Sit in a relaxed position in a chair, with your forearms resting on your legs or on the arms of the chair. When you are properly positioned, have someone start data collection. 9. Print or sketch the tracing for alternate limb lead placement only. Use this line as the Baseline -------------------------------- DATA ANALYSIS 1. Fill in the blanks to review the causes and effects of each interval of the EKG. a. The P wave is caused by ______________ and causes the atrial muscle to _____________. b. The QRS wave is caused by_____________ and causes the ventricles to _______________. c. The T wave is caused by _______________ after which the ventricles ______________. d. The QT interval is approximately the time for ventricles to ___________. This is called Systole e. During the period between the end of the T and the beginning of the next QRS wave the ventricles are ________ and ________. This is called Diastole. f. The R-R interval is the time between _________. This can be used to calculate the _____ _____in beats per minute by dividing 60 seconds by R-R. g. The PR interval is produced by the electrical signal starting in the AV node, flowing through the atria, and through the ________. What does the AV node do to the speed of this signal?____________Why?_________________. 2. Remember that a positive deflection indicates electrical activity moving toward the green EKG lead. Examine the two major deflections of a single QRS complex (R wave and S wave) in your EKG tracing from Part I of this experiment. According to this data, does ventricular depolarization proceed from right to left or left to right? _________________ How does your tracing from Part II confirm your answer?___________________________ 3. The diagram below is from your book. Use it to compare the waves of the ECG to sytole and diastole of the atria and ventricles. EKG Pathologies: Health-care professionals ask the following questions when interpreting an EKG: Can all components be identified in each beat? Are the intervals between each component and each complex consistent? Are there clear abnormalities of any of the wave components? Practice determining where the defect in the heart must be to produce each ECG. Write SA node, ventricle, or AV node on each graph to indicate where the abnormality probably is. a. b. c. d. e. f. g. h. EKG Pathologies: Health-care professionals ask the following questions when interpreting an EKG: Can all components be identified in each beat? Are the intervals between each component and each complex consistent? Are there clear abnormalities of any of the wave components? Using these questions as guides, analyze each of the following three-beat EKG tracings and record your conclusions in Table 3 (indicate presence or absence of the P wave, and whether other intervals and/or shapes are normal or abnormal). The first analysis (a) is done for you. a. b. c. d. e. f. g. h. Table 3 P Wave ECG a Abs. PR Interval Nml. Abs./Abn. QRS Interval Abs./Abn. Nml. Pres. 1 X X X X X 2 X X X X X 3 X X Abn. T Wave Shape Beat X Nml. QRS Shape Nml. X Abs./Abn. X 1 b 2 3 1 c 2 3 1 d 2 3 1 e 2 3 1 f 2 3 1 g 2 3 1 h 2 3 3. Which intervals from Table 1 decreased after exercise? (P-R Why? QRS QT R-R Heart rate) original instructions that were revised: PROCEDURE Part I Standard limb lead EKG 1. Setup: a. Turn on your computer and log in with your LSC password. b. Connect the EKG Sensor to gray/green box (LabQuest). c. Plug the USB cable from gray/green box into a USB port on the computer. (Any port on the computer should work.) d. Open the LoggerPro software from the icon on the computer desktop and choose File...menu...Human Physiology with Vernier... Analyzing EKG. A graph should appear on your computer screen.
