*** 1 - Wiley
advertisement

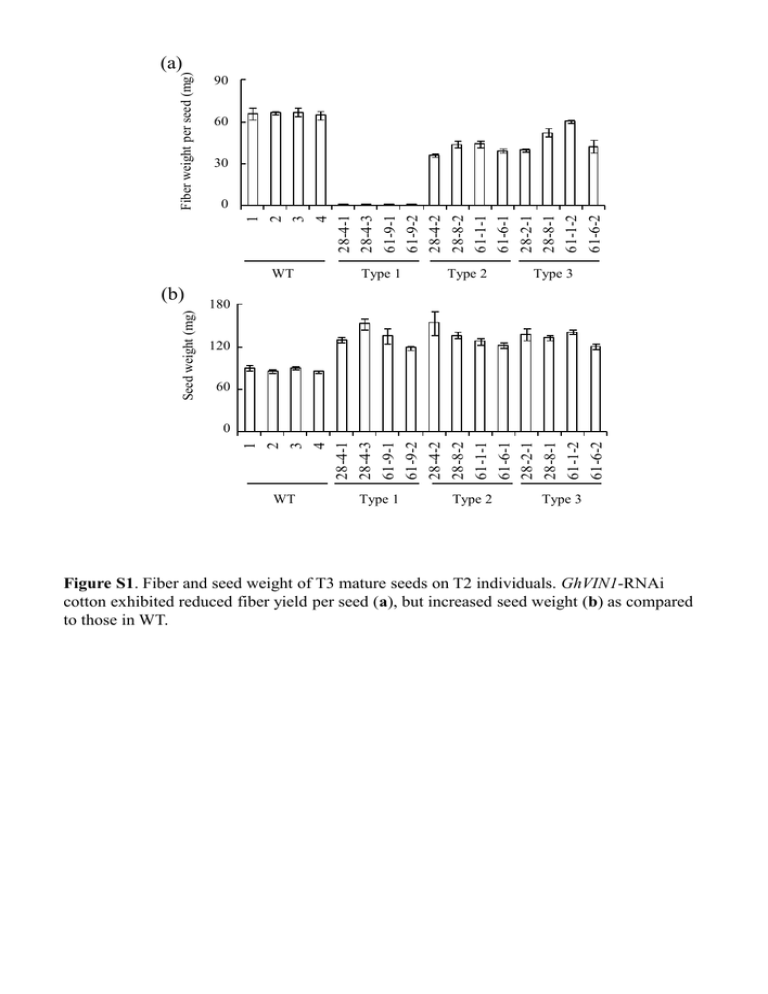
Fiber weight per seed (mg) (a) Fiber weight per seed (g) 0.09 90 60 0.06 30 0.03 1 2 3 4 28-4-1 28-4-3 61-9-1 61-9-2 28-4-2 28-8-2 61-1-1 61-6-1 28-2-1 28-8-1 61-1-2 61-6-2 00 WT Seed weight (g) Type 2 Type 3 180 0.18 Seed weight (mg) (b) Type 1 120 0.12 60 0.06 1 2 3 4 28-4-1 28-4-3 61-9-1 61-9-2 28-4-2 28-8-2 61-1-1 61-6-1 28-2-1 28-8-1 61-1-2 61-6-2 00 WT Type 1 Type 2 Type 3 Figure S1. Fiber and seed weight of T3 mature seeds on T2 individuals. GhVIN1-RNAi cotton exhibited reduced fiber yield per seed (a), but increased seed weight (b) as compared to those in WT. (a) WT Type 1 Type 2 Type 3 WT Type 1 Type 2 Type 3 GhCWIN1 GhSusA GhSUT1 Gh18srRNA (b) GhCWIN1 GhSusA GhSUT1 GhMST1 Gh18srRNA Figure S2. Representative results of RT-PCR analyses of the expression levels of GhCWIN1, GhSusA, GhSUT1, and GhMST1 in WT and GhVIN1-RNAi cotton seed at -1DAA (a) and 3DAA (b). WT -18 hours (a) -6 hours (b) -3 hours (c) D During flowering WT (d) WT(-control) (e) Type 1 (f) Figure S3. VIN activity became evident on the ovule surface , starting from the chalaza region (arrows) at about 6 hours before anthesis. Histochemical staining for Inv activity on the surface of WT ovules at ~18 (a), 6 (b) or 3 hours (c) before anthesis, and WT (d) and type 1 transgenic (f) ovules during flowering. (e) represents a background control of (d) with no added sucrose. Bars = 0.5mm. Sugar content (mg/g FW) a 20 WT 16 Type 1 (28-4-1) Type 1 (61-9-1) 12 8 4 a ab b a b b b b 0 Glu Fru Suc Figure S4. Glc and Fru levels were significantly reduced in 0 DAA type 1 transgenic seeds as compared to that in WT. Different letters indicate a significant difference at p < 0.05, according to randomization one-way ANOVA test. 100mM Glc + 20mM Fru (a) WT (b) Type 1 120mM Glc (c) 120mM Fru WT (d) WT WT Figure S5. Representative images of WT and type 1 GhVIN1-RNAi ovules cultured for 15 days on original BT medium (a and b, respectively) and WT ovules cultured on BT media supplemented with 120mM Glc (c) or Fru (d) for 15 days. Bars = 5 mm. (a) myb25li-a myb25li-d agpaseS amy iso1-b iso1-c PI-II ps20 sbeI vsp -1370 -572 -1132 -1375 -568 -514 -548 -172 -314 -759 --ACAACAATAATATAAAATAATGATAT-----AAACAAAATAAATAAAATTACTTAAT-----------TAAAATAAAAACAAAGG------------GCAGAAGATAAAAAAAACAA---------AATACCAAAAAATAATAATAAAA--------AAAAAATAAAGAAAATGAAATC-------ATGATAATTATTTAAAAAAACAAGCAAGT--------AATACTAATAAAGAATAGAAAAAG ------ACATAAAATAAAAAAAGG------------AAAGAAAATAAAAAATAAAG------- -1345 -597 -1116 -1356 -546 -494 -520 -149 -297 -778 (b) GhMYB25like-A SURE -1362 -1354 AATATAAAA +1 +134 Start codon TATA box GhMYB25like-D SURE SP8b SP8b SP8b SP8b-like -587 -580 -556 -550 -280 -246 -240 -681 -675 AATAAAAT-----TACTtTT -286 TACTtTT-----TACTtTT TACTtTT +1 TATA box +178 Start codon Figure S6. Sugar-responsive elements in GhMYB25like promoter. (a) Alignment of SURE sequences in promoters of GhMYB25like and other plant genes known to be subjected to sugar-induced expression. Conserved A nucleotides are in bold and flanked by putative consensus core (AA/TAA) highlighted in yellow. myb25li-a and myb25li-d refer to the SURE sequence of cotton MYB25like promoter from A- and Dgenome, respectively; agpaseS, barley gene for agpaseS (Thorbjørnsen et al., 1996); amy, Arabidopsis gene for β-amylase (Mita et al., 1995); iso-b and iso-c, barley iso1 promoter SURE-b and SURE-c respectively (Sun et al., 2003); PI-II, potato gene for proteinase inhibitor II (Kim et al., 1991); ps20, potato patatin class I gene (Grierson et al., 1994); sbeI, maize sbeI (Kim and Guiltinan, 1999); vsp, soybean gene for vegetative storage protein (Rhee and Staswick., 1992). (b) Schematic representation of the sugar-responsive elements SURE and SP8b-like in GhMYB25like promoters from cotton A- and D-genome. The position of SURE and SP8b- like are numbered relative to the putative transcription start site (+1). Core element of SP8b, ACT, is highlighted in bold. Mismatches are indicated with lower case letter in SP8b-like element. (b) WT GhExp1 GhExp2 Gh18srRNA Type 1 Type 2 Type 3 Relative expression level intensity Relative (a) 2.5 2.5 WT Type 2 a 2.02 Type 1 Type 3 1.5 1.5 1.01 b b b 00 a b b 0.5 0.5 GhExp1 GhAExp1 b WT Type 1 Type 2 Type 3 GhExp2 GhExp2 Figure S7. RT-PCR analyses of the expression levels of cotton genes encoding two expansins (a) in WT and GhVIN1-RNAi transgenic 3 DAA seeds. Values in the according graph (b) are presented as ratio of densitometric readings of samples to corresponding Gh18srRNA gene expression levels.


