Chapter 13 Word
advertisement
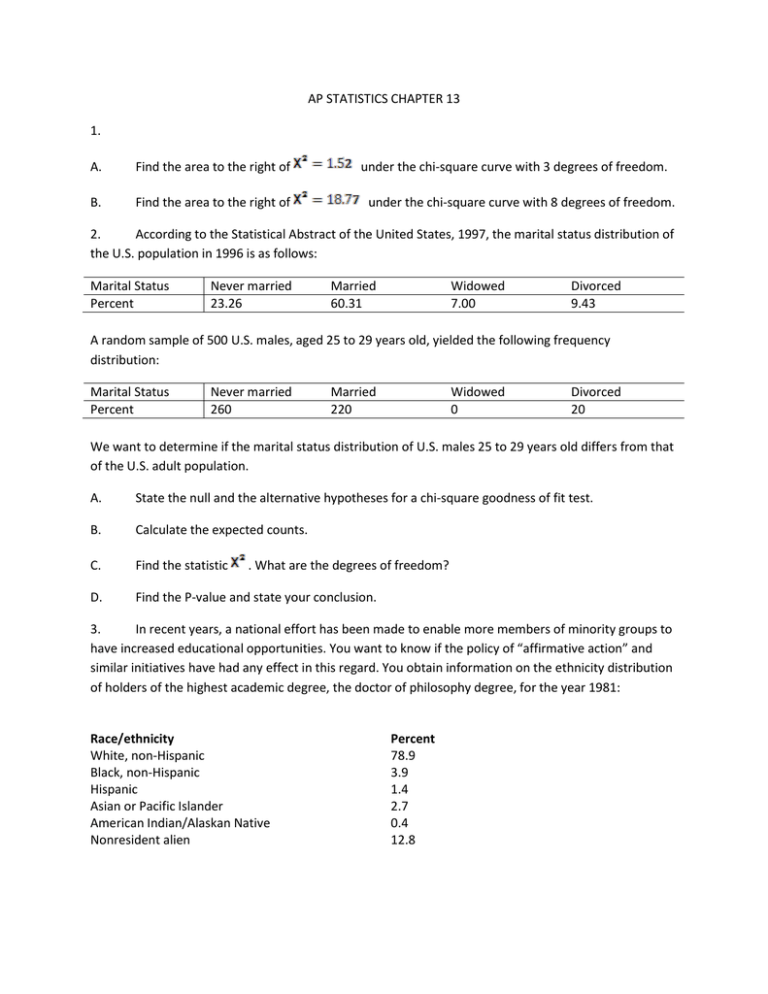
AP STATISTICS CHAPTER 13 1. A. Find the area to the right of B. Find the area to the right of under the chi-square curve with 3 degrees of freedom. under the chi-square curve with 8 degrees of freedom. 2. According to the Statistical Abstract of the United States, 1997, the marital status distribution of the U.S. population in 1996 is as follows: Marital Status Percent Never married 23.26 Married 60.31 Widowed 7.00 Divorced 9.43 A random sample of 500 U.S. males, aged 25 to 29 years old, yielded the following frequency distribution: Marital Status Percent Never married 260 Married 220 Widowed 0 Divorced 20 We want to determine if the marital status distribution of U.S. males 25 to 29 years old differs from that of the U.S. adult population. A. State the null and the alternative hypotheses for a chi-square goodness of fit test. B. Calculate the expected counts. C. Find the statistic D. Find the P-value and state your conclusion. . What are the degrees of freedom? 3. In recent years, a national effort has been made to enable more members of minority groups to have increased educational opportunities. You want to know if the policy of “affirmative action” and similar initiatives have had any effect in this regard. You obtain information on the ethnicity distribution of holders of the highest academic degree, the doctor of philosophy degree, for the year 1981: Race/ethnicity White, non-Hispanic Black, non-Hispanic Hispanic Asian or Pacific Islander American Indian/Alaskan Native Nonresident alien Percent 78.9 3.9 1.4 2.7 0.4 12.8 A random sample of 300 doctoral degree recipients in 1994 showed the following frequency distribution: Race/ethnicity White, non-Hispanic Black, non-Hispanic Hispanic Asian or Pacific Islander American Indian/Alaskan Native Nonresident alien Count 189 10 6 14 1 80 A. Perform a goodness of fit test to determine if the distribution of doctoral degrees in 1994 is significantly different from the distribution in 1981. Write your hypotheses and state a conclusion. B. In which category did the greatest change occur, and in which direction? 4. This exercise will test you TI-84’s built-in random number generator. Use the calculator to generate 200 random digits. Then perform a goodness of fit test to see if the distribution of digits in your sample is different from the distribution that you would expect. 5. Simulate rolling a fair die 300 times on a TI-84 calculator. Plot the histogram of the results, and then perform a goodness of fit test of the hypothesis that the die is fair. 6. A statistics student suspected that his 1982 penny was not a fair coin, so he held it upright on a tabletop with a finger of one hand and spun the penny repeatedly with the thumb and index finger of the other hand. In 200 spins of the coin, the tail side of the coin came up 152 times. Perform the goodness of fit test to see if there is sufficient evidence to conclude that spinning the coin does not produce equally likely results (CLASS ACTIVITY). 7. A die is tossed 200 times with the faces 1, 2, 3, 4, 5, and 6 turning up with frequencies 26, 36, 39, 30, 38, and 31 respectively. Is there reason to believe that the die is “loaded” (unfair)? 8. Trix cereal comes in five fruit flavors, and each flavor has a different shape. A curious student methodically sorted an entire box of cereal and found the following distribution of flavors for the pieces of cereal in the box: Flavor Frequency Grape 530 Lemon 470 Lime 420 Orange 610 Strawberry 585 Test the null hypothesis that the flavors are uniformly distributed versus the alternative that they are not. 9. A “wheel of fortune” at a carnival is divided into four equal parts: Part I: Win a doll Part II: Win a candy bar Part III: Win a free ride Part IV: Win nothing You suspect that the wheel is unbalanced. (Note: Not all part of the wheel are equally likely to be landed upon when the wheel is spun). The results of 500 spins of the wheel are as follows: Part Frequency I 95 II 105 III 135 IV 165 Perform a goodness of fit test. Is there evidence that the wheel is not in balance? 10. North Carolina State University studied student performance in a course required by its chemical engineering major. One question of interest is the relationship between time spent in extracurricular activities and whether a student earned a C or better in the course. Here are the data for the 119 students who answered a question about extracurricular activities: C or better D or F A. Extracurricular Activities <2 11 9 (hours per week) 2 to 12 68 23 >12 3 5 This is an r x c table. What are the numbers for r and c? B. Find the proportions of successful students (C or better) in each of the three extracurricular activity groups. What kind of relationship between extracurricular activities and succeeding in the course do these proportions seem to show? C. Make a bar chart to compare the three proportions of successes? D. The null hypothesis says that the proportions of successes are the same in all three groups if we look at the population of all students. Find the expected counts if this hypothesis is true, and display them in a two-way table. E. Compare the observed counts with the expected counts. Are there large deviations between them? These deviations are another way of describing the relationship in (B). 11. How are the smoking habits of students related to their parents’ smoking? Here are the data from a survey of students in eight Arizona high schools: Student Smokes 400 416 188 Both parents smoke One parent smokes Neither parent smokes A. Student doesn’t smoke 1380 1823 1168 This is an r x c table. What are the numbers r and c? B. Calculate the proportion of students who smoke in each of the three parent groups. Then describe in words the association between parent and student smoking. C. Make a graph to display the association. D. Explain in words what the null hypothesis H 0 : p1 p2 p3 says about student smoking. E. Find the expected counts if of observed counts. is true, and display them in a two-way table similar to the table F. Compare the tables of observed and expected counts. Explain how the comparison expresses the same association you see in (B) and (C). 12. From problem 10, you began to analyze data on the relationship between time spent on extracurricular activities and success in a tough course. The minitab output is listed below: Expected counts are printed below the observed counts c1 11 13.78 c2 68 62.71 c3 3 5.51 Total 82 2 9 6.22 23 28.29 5 2.49 37 Total 20 91 8 119 ChiSq 0.561 + 1.244 + 0.447 + 0.991 + 1.145 + 2.538 = 6.926 1 df = 2 1 cell with expected counts less than 5.0 A. Chisquare 2. 6.92 .9687 Starting from the table of expected counts, find the 6 components of the chi-square statistic and then the statistic itself. Check your work against the computer output. B. What is the P-value for the test? Explain in simple language what it mean to reject the null in this setting. C. Which term contributes the most to ? What specific relation between extracurricular activities and academic success does this term point to? D. Does the North Carolina State study convince you that spending more or less time on extracurricular activities causes changes in academic success? Explain you answer. 13. The North Carolina State study also looked at the relationship between student goals and success in getting a C or better in the course. They study report says: “The probability of passing CHE 205 was different for students who would be satisfied with a grade C or better (36% of 14 students), B of better (64% of 64), A (90% of 30), creative work an A+ (82% of 11).” A. Use the information given to make a 4 x 2 table by success or failure for the 119 students. B. Find the expected counts. The expected counts don’t pass our rule of safe practice. Why? Chisquare distribution P-values are nonetheless reasonably accurate. C. Confirm that the chi-square statistic for this table is freedom. Use Table E to approximate the P-value for this statistic. D. . Give the degrees of Describe briefly the relationship between students’ goals and their grades in the course. 14. The previous chapter compared HMO members who filed complaints with an SRS of members who did not complain. The study actually broke the complainers into subgroups: those who filed complaints about medical treatment and those who filed nonmedical complaints. Here are the data on the total number in each group and the number who voluntarily left the HMO: Total Left No Complaints 743 22 Medical Complaints 199 26 Nonmedical Complaints 440 28 A. Find the percent of each group who left. B. Make a two-way table of complaint status by left or not. C. Find the expected counts and check that you can safely use the chi-square test. D. Determine the chi-square statistic for this test. What null and alternative hypotheses does this statistic test? What are its degrees of freedom? Use Table E to approximate the P-value. E. What do you conclude? 15. A large study of child care used samples from the data tapes of the Current Population Survey over a period of several years. The result is close to an SRS of child-care workers. The Current Population Survey has three classes of child-care workers: private household, nonhousehold, and preschool teacher. Here are data on the number of blacks among women workers in these three classes: Household Nonhousehold Teachers Total 2455 1191 659 Black 172 167 86 A. What percent of each class of child-care workers is black? B. Make a two-way table of class or worker by race (black or other). C. Can we safely use the chi-square test? What null and alternative hypothesis does test? D. Calculate the chi-square statistic for this table. What are its degrees of freedom? Use Table E to approximate the P-value. E. What do you conclude from the data? 16. It seems that the attitude of cancer patients can influence the progress of their disease. We can’t experiment with humans, but here is a rat experiment on this theme. Inject 60 rats with tumor cells and then divide them at random into two groups of 30. All the rats receive electric shocks, but Group 1 can end the shock by pressing a lever. (Rats learn this sort of thing quickly.) The rats in Group 2 cannot control the shocks, which presumably makes them helpless and unhappy. We suspect that the rats in Group 1 will develop fewer tumors. The results: 11 of the Group 1 rats and 22 of the Group 2 rats developed tumors. A. Stat e the null and alternative hypotheses for this investigation. Explain why the p test rather than the chi-square test for a 2 x 2 table is the proper test. B. Carry out the test and report your conclusion. 17. Do unregulated providers of child care in their homes follow different health and safety practices in different cities? A study looked at people who regularly provided care for someone else’s children in poor areas of three cities. The numbers who required medical releases from parents to allow medical care in an emergency were 42 of 73 providers in Newark, N.J., 29 of 101 in Camden, N.J., and 48 of 107 in South Chicago, Ill. A. Use the chi-square test to see if there are significant differences among the proportions of childcare providers who require medical releases in the three cities. B. How should the data be produced in order for your test to be valid? (In fact, the samples came in part from asking parents who were subjects in another study who provided their child care. The author of the study wisely did not sue a statistical test. He wrote: “Application of conventional statistical procedures appropriate for random samples may produce biased and misleading results.”) 18. Sample surveys on sensitive issues can give different can give results depending on how the question is asked. A University of Wisconsin study divided 2400 respondents into 3 groups at random. All were asked if they had ever used cocaine. One group was interviewed by phone; 21% said they had used cocaine. Another 800 people were asked the question in a one-on-one personal interview; 25% said “Yes.” The remaining 800 were allowed to make an anonymous written response; 28% said “Yes.” Are there statistically significant differences among these proportions? 19. How accurate are pre-election polls of voter’s intentions? The 1992 presidential election featured the Republican incumbent, George Bush, the Democrat Bill Clinton, and the third-party candidate Ross Perot. Clinton was elected. Here are the results for three polls taken a few days before the election, as well as the actual election result. The poll results don’t add to 100% because some voters were undecided. ABC News USA Today/CNN NY Times/CBS Actual vote Sample Size 912 1610 1912 Bush 38% 39% 34% 38% Clinton 41% 42% 43% 43% Perot 18% 14% 15% 19% The polls use complex multistage samples for design. For the purposes of this exercise, treat each poll as an SRS of registered voters. A. Did the three polls differ significantly in the percent of their samples who favored the winner, Bill Clinton? B. For each poll individually, test whether its percent for Ross Perot differs significantly at the level from the actual election result, which is 19%.
